Cathay Pacific 2015 Annual Report Download - page 5
Download and view the complete annual report
Please find page 5 of the 2015 Cathay Pacific annual report below. You can navigate through the pages in the report by either clicking on the pages listed below, or by using the keyword search tool below to find specific information within the annual report.-
 1
1 -
 2
2 -
 3
3 -
 4
4 -
 5
5 -
 6
6 -
 7
7 -
 8
8 -
 9
9 -
 10
10 -
 11
11 -
 12
12 -
 13
13 -
 14
14 -
 15
15 -
 16
16 -
17
-
18
-
19
-
20
-
21
-
22
-
23
-
24
-
25
-
26
-
27
-
28
-
29
-
30
-
31
-
32
-
33
-
34
-
35
-
36
-
37
-
38
-
39
-
40
-
41
-
42
-
43
-
44
-
45
-
46
-
47
-
48
-
49
-
50
-
51
-
52
-
53
-
54
-
55
-
56
-
57
-
58
-
59
-
60
-
61
-
62
-
63
-
64
-
65
-
66
-
67
-
68
-
69
-
70
-
71
-
72
-
73
-
74
-
75
-
76
-
77
-
78
-
79
-
80
-
81
-
82
-
83
-
84
-
85
-
86
-
87
-
88
-
89
-
90
-
91
-
92
-
93
-
94
-
95
-
96
-
97
-
98
-
99
-
100
-
101
-
102
-
103
-
104
-
105
-
106
-
107
-
108
-
109
-
110
-
111
-
112
-
113
-
114
-
115
-
116
 |
 |

Annual Report 2015
3
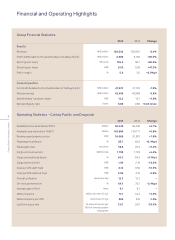
The Cathay Pacific Group reported an attributable profit of HK$6,000 million for 2015. This
compares to a profit of HK$3,150 million in 2014. Earnings per share were HK152.5 cents
compared to HK80.1 cents in the previous year.
Chairman’s Letter
The Group’s performance in 2015 was better than in 2014.
The business benefited from low fuel prices. The high
passenger load factors experienced in the first half of the
year continued in the second half. This reflected strong
economy class demand. Premium class demand was not as
strong as expected on some long-haul routes. Air cargo
demand, which came under pressure during the second
quarter of the year, remained weak in the second half. There
was an improved contribution from the Group’s subsidiary
and associated companies.
The Group’s passenger revenue in 2015 was HK$73,047
million, a decrease of 3.5% compared to 2014. Capacity
increased by 5.9%, reflecting the introduction of new routes
(to Boston, Düsseldorf, Hiroshima and Zurich) and increased
frequencies on some other routes. The load factor
increased by 2.4 percentage points, to 85.7%. Strong
competition, a significant reduction in fuel surcharges,
unfavourable foreign currency movements and the fact that
a higher proportion of passengers were connecting through
Hong Kong put downward pressure on yield, which
decreased by 11.4%, to HK59.6 cents. Economy class
demand was strong. Premium class demand improved on
regional routes but was not as strong as expected on some
long-haul routes.
The Group’s cargo revenue in 2015 was HK$23,122 million,
a decrease of 9.0% compared to the previous year. This
mainly reflected a reduction in fuel surcharges consequent
upon lower fuel prices. Capacity for Cathay Pacific and
Dragonair increased by 5.4%. The load factor decreased by
0.1 percentage point to 64.2%. Strong competition,
overcapacity, unfavourable foreign currency movements
and the reduction in fuel surcharges put pressure on yield,
which decreased by 13.2%, to HK$1.90. Demand was strong
in the first quarter of 2015, assisted by industrial action at
ports on the west coast of the United States. Overall
demand was weak for the rest of the year, particularly on
European routes.
Total fuel costs for Cathay Pacific and Dragonair (before the
effect of fuel hedging) decreased by HK$14,561 million (or
37.8%) compared to 2014, despite increases in capacity. A
40.3% decrease in average prices was partially offset by a
4.3% increase in consumption. Fuel is still the Group’s most
significant cost, accounting for 34.0% of our total operating
costs in 2015 (compared to 39.2% in 2014). Fuel hedging
losses reduced the benefit of lower fuel costs. After taking
hedging losses into account, fuel costs decreased by
HK$7,331 million (or 18.2%) compared to 2014.
The Group’s operating expenses exclusive of fuel increased
by 2.3% in 2015 compared to 2014. This was mainly due to
increased operations and a corresponding increase in the
size of the workforce. Congestion at Hong Kong
International Airport and air traffic control constraints in the
Greater China region also increased operating expenses.
Productivity improvements and favourable foreign currency
movements kept the increase in non-fuel costs below the
increase in capacity. There was a 3.1% reduction in non-fuel
costs per ATK.
The contribution from Air China (the results of which are
included in the Group’s results three months in arrear) was
significantly higher in 2015 than in 2014. The improvement
principally reflected low fuel prices and strong passenger
demand. In August 2015, devaluation of the Renminbi led to
significant foreign exchange losses for Air China. However,
the foreign exchange losses were more than offset by
savings from low fuel prices.