Canon 2002 Annual Report Download - page 3
Download and view the complete annual report
Please find page 3 of the 2002 Canon annual report below. You can navigate through the pages in the report by either clicking on the pages listed below, or by using the keyword search tool below to find specific information within the annual report.-
 1
1 -
 2
2 -
 3
3 -
 4
4 -
 5
5 -
 6
6 -
 7
7 -
 8
8 -
 9
9 -
 10
10 -
 11
11 -
 12
12 -
 13
13 -
 14
14 -
15
-
16
-
17
-
18
-
19
-
20
-
21
-
22
-
23
-
24
-
25
-
26
-
27
-
28
-
29
-
30
-
31
-
32
-
33
-
34
-
35
-
36
-
37
-
38
-
39
-
40
-
41
-
42
-
43
-
44
-
45
-
46
-
47
-
48
-
49
-
50
-
51
-
52
-
53
-
54
-
55
-
56
-
57
-
58
-
59
-
60
-
61
-
62
-
63
-
64
-
65
-
66
-
67
-
68
-
69
-
70
-
71
-
72
-
73
-
74
-
75
-
76
-
77
-
78
-
79
-
80
 |
 |

1
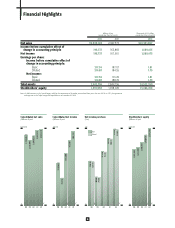
Net sales
Income before cumulative effect of
change in accounting principle
Net income
Earnings per share:
Income before cumulative effect of
change in accounting principle:
Basic
Diluted
Net income:
Basic
Diluted
Total assets
Stockholders’ equity
Note:U.S. dollar amounts in this Annual Report, solely for the convenience of the reader, are translated from yen at the rate of ¥120 = US$1, the approximate
exchange rate on the Tokyo Foreign Exchange Market as of December 30, 2002.
2002
¥2,940,128
190,737
190,737
217.56
214.80
217.56
214.80
2,942,706
1,591,950
2001
2,907,573
163,869
167,561
187.07
184.55
191.29
188.70
2,844,756
1,458,476
2002
$24,501,067
1,589,475
1,589,475
1.81
1.79
1.81
1.79
24,522,550
13,266,250
Millions of yen
(except per share amounts) Thousands of U.S. dollars
(except per share amounts)
126.10
123.93
80.66
79.50
2,736,084
2,530,896
2,696,420
2,907,573
2,940,128
98 99 00 01 02 98 99 00 01 02
0
98
0
99 00 01 02
Consolidated net sales
(Millions of yen)
3,000,000
1,155,520
1,202,003
1,298,914
1,458,476
1,591,950
98 99 00 01 02
0
1,600,000
109, 569
70,234
134,088
167,561
190,737
0
200,000 220
Basic
Diluted
Consolidated net income
(Millions of yen) Stockholders’ equity
(Millions of yen)
Net income per share
(Yen)
153.66
151.51
191.29
188.70
217.56
214.80
Financial Highlights