Build-A-Bear Workshop 2013 Annual Report Download - page 10
Download and view the complete annual report
Please find page 10 of the 2013 Build-A-Bear Workshop annual report below. You can navigate through the pages in the report by either clicking on the pages listed below, or by using the keyword search tool below to find specific information within the annual report.-
 1
1 -
 2
2 -
 3
3 -
 4
4 -
 5
5 -
 6
6 -
 7
7 -
 8
8 -
 9
9 -
 10
10 -
 11
11 -
 12
12 -
 13
13 -
 14
14 -
 15
15 -
 16
16 -
 17
17 -
 18
18 -
 19
19 -
 20
20 -
 21
21 -
22
-
23
-
24
-
25
-
26
-
27
-
28
-
29
-
30
-
31
-
32
-
33
-
34
-
35
-
36
-
37
-
38
-
39
-
40
-
41
-
42
-
43
-
44
-
45
-
46
-
47
-
48
-
49
-
50
-
51
-
52
-
53
-
54
-
55
-
56
-
57
-
58
-
59
-
60
-
61
-
62
-
63
-
64
-
65
-
66
-
67
-
68
 |
 |

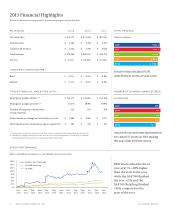
REVENUES 2013 2012 2011
Net retail sales $ 373,173 $ 374,553 $ 387,041
Franchise fees $ 3,564 $ 3,598 $ 3,391
Commercial revenue $ 2,332 $ 2,790 $ 3,943
Total revenues $ 379,069 $ 380,941 $ 394,375
Net loss $ (2,112) $ (49,295) $ (17,062)
LOSS PER COMMON SHARE
Basic $ (0.13) $ (3.02) $ (0.98)
Diluted $ (0.13) $ (3.02) $ (0.98)
OTHER FINANCIAL AND STORE DATA (1)
Retail gross margin (dollars) (2) $ 153,477 $ 145,687 $ 154,468
Retail gross margin (percent) (2) 41.1% 38.9% 39.9%
Number of company-owned stores 323 351 356
at end of period
North American average net retail sales per store $ 1,080 $ 1,003 $ 1,021
North American net retail sales per gross square foot $ 381 $ 350 $ 354
1. For description of this financial and store data, please see the fiscal 2014 Annual Report on Form 10-K.
2. Retail gross margin represents net retail sales less cost of retail merchandise sold. Retail gross margin
percentage represents retail gross margin divided by net retail sales.
TOTAL REVENUE
Dollars in millions
NUMBER OF COMPANY-OWNED STORES
At end of period
STOCK PERFORMANCE
BBW vs. S&P 500 Retailing Index vs. S&P 500 Index for Fiscal Year 2013
2013 Financial Highlights
Dollars in thousands, except per share, per store and per gross square foot data
Total revenue declined 0.5%
with 28 fewer stores at year's end.
As part of our real estate optimization
we closed 37 stores in 2013 ending
the year with 28 fewer stores.
BBW stock ended the fiscal
year at $7.74, +98% higher
than the start of the year
while the S&P 500 finished
the year +31% and the
S&P 500 Retailing finished
+46% compared to the
start of the year.
$395.9
350
2009
2009
2010
2010
2011
2011
2012
2012
2013
2013
$401.5
359
$394.4
356
$380.9
351
$379.1
323
160%
140%
120%
100%
80%
60%
40%
20%
0%
Dec
2012
Jan
2013
Feb
2013
Mar
2013
Apr
2013
May
2013
June
2013
July
2013
Aug
2013
Sept
2013
Oct
2013
Nov
2013
Dec
2013
Build-A-Bear Workshop
S&P 500 Retailing
S&P 500
8 BUILD- A-BEAR WORKSHOP, INC. 2013 ANNUAL REPORT