Brother International 2016 Annual Report Download - page 8
Download and view the complete annual report
Please find page 8 of the 2016 Brother International annual report below. You can navigate through the pages in the report by either clicking on the pages listed below, or by using the keyword search tool below to find specific information within the annual report.-
 1
1 -
 2
2 -
 3
3 -
 4
4 -
 5
5 -
 6
6 -
 7
7 -
 8
8 -
 9
9
 |
 |
B I, .
ay 9, 6
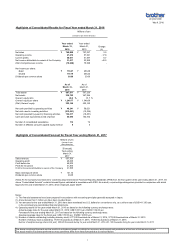
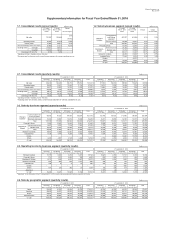
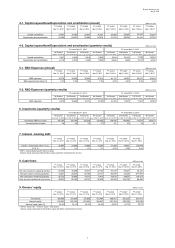
3-1. Consolidated results (annual)
(Millions of yen)
FY ended FY ended FY ended FY ended FY ended FY ended FY ended FY ending
Mar 31, 2010 Mar 31, 2011 Mar 31, 2012 Mar 31, 2013 Mar 31, 2014 Mar 31, 2015 Mar 31, 2016 Mar 31, 2017
<J-GAAP>
forecast
<IFRS>
Net sales 446,269 502,830 497,390 516,066 616,834 707,237 745,888 657,500
Operating income 26,637 36,092 34,183 29,775 43,301 57,541 47,276 45,000
Current profits 29,664 38,612 34,351 23,144 35,613 51,557 48,611 -
Income Before Tax 26,233 34,061 34,107 27,946 33,527 65,399 49,346 45,000
Net income Attributable to owners of the company
19,629 26,238 19,525 17,826 19,220 53,969 31,017 31,500
Exchange rates Yen-USD 93.04 85.82 79.30 83.23 100.00 110.03 120.16 110.00
Yen-EUR 130.62 113.56 110.17 107.57 134.01 138.68 132.36 125.00
Overseas sales ratio (%) 80.2% 76.6% 77.0% 77.0% 79.5% 81.9% 81.7% -
Operating profit ratio (%) 6.0% 7.2% 6.9% 5.8% 7.0% 8.1% 6.3% 6.8%
ROE (%) 9.6% 12.1% 8.7% 7.2% 6.9% 16.8% 9.2% -
ROA (%) 5.6% 7.1% 5.3% 4.5% 4.3% 10.4% 5.0% -
Net income per share (yen) 73.34 98.03 72.95 66.65 72.20 206.68 119.47 121.32
* "Exchange rates" are the rates used to convert financial statements of overseas subsidiaries into yen.
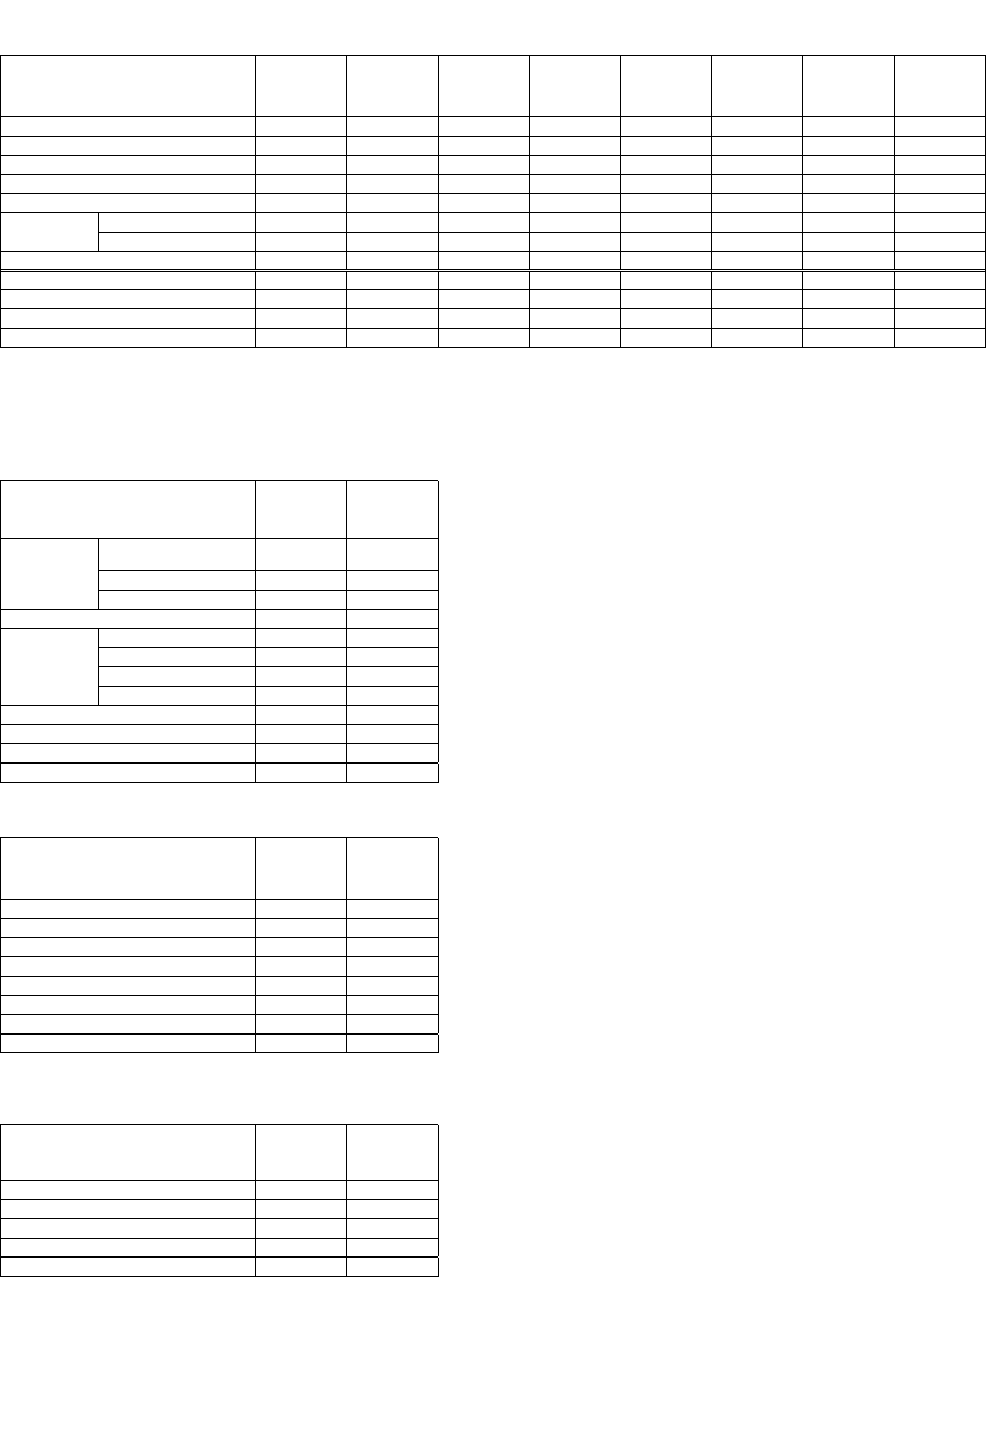
3-2. Sales by business segment
(Millions of yen)
FY ended FY ending
Mar 31, 2016 Mar 31, 2017
<J-GAAP>
forecast
<IFRS>
Communications and
Printing equipment 421,494 338,900
Electronic stationery 55,273 45,600
Total 476,767 384,500
52,797 48,800
Industrial sewing machines 30,758 31,400
Machine tools 50,648 44,300
Industrial Parts 18,314 20,200
Total 99,722 95,900
53,697 52,500
48,312 61,400
14,591 14,400
745,888 657,500
3-3. Operating income by business seg
m
(Millions of yen)
FY ended FY ending
Mar 31, 2016 Mar 31, 2017
<J-GAAP>
forecast
<IFRS>
Printing & Solutions 34,184 29,400
Personal & Home 4,846 3,700
Machinery & Solution 11,236 5,600
Network & Contents -277 1,800
Domino -2,024 4,000
Others 1,275 500
Adjustment -1,965 -
G. total 47,276 45,000
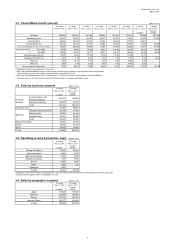
3-4. Sales by geographic segment
(Millions of yen)
FY ended FY ending
Mar 31, 2016 Mar 31, 2017
<J-GAAP>
forecast
<IFRS>
Japan 175,627 170,900
Americas 252,546 183,400
Europe 191,536 202,200
Asia and Others 126,177 101,000
G. total 745,888 657,500
Network & Contents
*"Adjustment" in the forecast for the FY ending March 31, 2016 is mainly costs associated with the share acquisition of Domino, which was
recorded in the first quarter of the FY ending March 31, 2016.
Others
Domino
* Operating profit ratio = Operating income / Net sales
* ROE = Net income Attributable to owners of the company / Owners' equity (average of opening balance and ending balance)
Owners' equity represents Shareholders' equity and Other comprehensive income.
* ROA = Net income Attributable to owners of the company / Total assets (average of opening balance and ending balance)
G. total
Printing &
Solutions
Machinery
Personal & Home
2