Brother International 2016 Annual Report Download - page 5
Download and view the complete annual report
Please find page 5 of the 2016 Brother International annual report below. You can navigate through the pages in the report by either clicking on the pages listed below, or by using the keyword search tool below to find specific information within the annual report.-
 1
1 -
 2
2 -
 3
3 -
 4
4 -
 5
5 -
 6
6 -
 7
7 -
 8
8 -
 9
9
 |
 |

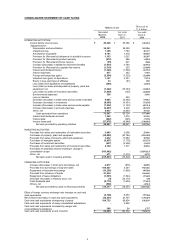
CONSOLIDATED STATEMENT OF CASH FLOWS
OPERATING ACTIVITIES:
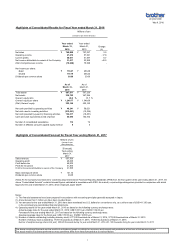
Income before income taxes Y 49,346 Y 65,399 $ 436,694
Adjustments for:
Depreciation and amortization 34,341 28,205 303,906
Impairment loss 1,168 1,784 10,337
Amortization of goodwill 6,781 1,318 60,010
Provision for (Reversal of) allowance for doubtful accounts 1,153 1,027 10,207
Provision for (Reversal of) product warranty (212) 586 (1,883)
Provision for (Reversal of) bonus reserve (95) 627 (846)
Increase (Decrease) in liability for retirement benefits (1,915) 4,784 (16,951)
Provision for (Reversal of) copyright fee reserve (1,310) 233 (11,600)
Interest and dividend income (1,324) (1,532) (11,721)
Interest expenses 871 342 7,710
Foreign exchange loss (gain) (2,554) (7,225) (22,608)
Valuation loss (gain) on derivatives 1,127 2,341 9,974
Equity in loss (earnings) of affiliates 33 (61) 298
Loss (Gain) from liquidation of subsidiaries (304) -(2,692)
(1,342) (15,743) (11,883)
Loss (Gain) on sales of investment securities (1,450) (125) (12,838)
Environmental expenses 338 -2,996
Loss on disaster -249 -
Decrease (Increase) in trade notes and accounts receivable 6,085 (6,293) 53,852
Decrease (Increase) in inventories (8,095) (6,451) (71,638)
Increase (Decrease) in trade notes and accounts payable (7,832) (1,153) (69,314)
Increase (Decrease) in accrued expenses (2,297) 2,229 (20,329)
Other, net 4,037 (3,807) 35,728
Cash generated from operations 76,547 66,734 677,408
Interest and dividends received 1,392 1,579 12,326
Interest paid (822) (345) (7,276)
Income taxes paid (27,876) (9,946) (246,692)
Net cash provided by operating activities Y 49,241 Y 58,021 $ 435,766
INVESTING ACTIVITIES:
Proceeds from sales and redemption of marketable securities 2,903 3,008 25,696
Purchases of property, plant and equipment (32,025) (23,784) (283,410)
Proceeds from sales of property, plant and equipment 3,452 17,964 30,550
Purchases of intangible assets (6,957) (7,179) (61,575)
Purchases of investment securities (637) (5,398) (5,639)
Proceeds from sales and redemption of investment securities 4,164 1,377 36,856
(186,462) -(1,650,115)
Other, net 471 (1,312) 4,170
Net cash used in investing activities Y (215,091) Y (15,326) $ (1,903,467)
FINANCING ACTIVITIES:
Increase (Decrease) in short-term borrowings, net 4,977 (875) 44,050
Proceeds from borrowings of long-term debt 109,427 3,547 968,386
Repayment of long-term borrowings (10,236) (1,800) (90,586)
Proceeds from issuance of bonds 41,430 -366,646
Repayment of lease obligations (1,993) (1,544) (17,642)
Decrease (Increase) in treasury stock, net (4) (10,174) (40)
Cash dividends paid (8,774) (7,604) (77,653)
Others, net (509) -(4,512)
Net cash provided by (used in) financing activities Y 134,317 Y (18,451) $ 1,188,648
(6,708) 8,553 (59,366)
Net increase (decrease) in cash and cash equivalents (38,241) 32,797 (338,419)
Cash and cash equivalents at beginning of period 104,732 68,934 926,839
Cash and cash equivalents of newly consolidated subsidiaries -2,905 -
198 94 1,757
Cash and cash equivalents at end of period Y 66,690 Y 104,732 $ 590,178
Effect of foreign currency exchange rate changes on cash and
cash equivalents
Cash and cash equivalents increased by merger with
unconsolidated subsidiaries
2016
Purchases of subsidiary shares resulting in change in
consolidation scope
2015
2016
Loss (Gain) on sales and disposals of property, plant and
equipment, net
March 31,
March 31,
March 31,
Millions of yen
Thousands of
U.S. dollars
Year ended
Year ended
Year ended
5