Brother International 2016 Annual Report Download - page 3
Download and view the complete annual report
Please find page 3 of the 2016 Brother International annual report below. You can navigate through the pages in the report by either clicking on the pages listed below, or by using the keyword search tool below to find specific information within the annual report.-
 1
1 -
 2
2 -
 3
3 -
 4
4 -
 5
5 -
 6
6 -
 7
7 -
 8
8 -
 9
9
 |
 |

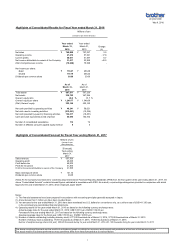
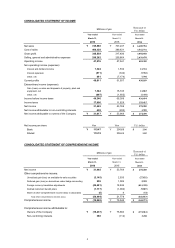
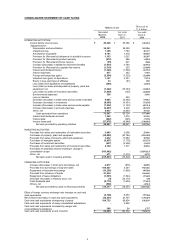
CONSOLIDATED STATEMENT OF INCOME
Net sales
Y 745,888 Y 707,237 $ 6,600,781
Cost of sales 400,328 389,831 3,542,731
Gross profit 345,559 317,406 3,058,050
Selling, general and administrative expenses 298,282 259,864 2,639,670
Operating income 47,276 57,541 418,380
Non-operating income (expenses):
Interest and dividend income 1,324 1,532 11,721
Interest expenses (871) (342) (7,710)
Other, net 881 (7,174) 7,798
Current profits 48,611 51,557 430,189
Extraordinary income (expenses):
1,342 15,743 11,883
Other, net (607) (1,902) (5,378)
Income before income taxes 49,346 65,399 436,694
Income taxes 17,900 11,629 158,415
Net income 31,445 53,769 278,280
Net income attributable to non-controlling interests 428 (200) 3,789
Net income attributable to owners of the Company Y 31,017 Y 53,969 $ 274,490
Net income per share:
Basic Y 119.47 Y 206.68 $ 1.06
Diluted 119.19 206.24 1.05
CONSOLIDATED STATEMENT OF COMPREHENSIVE INCOME
Net income Y 31,445 Y 53,769 $ 278,280
Other comprehensive income:
Unrealized gain (loss) on available-for-sale securities (3,145) 2,935 (27,832)
Deferred gain (loss) on derivatives under hedge accounting 255 1,086 2,258
Foreign currency translation adjustments (46,481) 18,846 (411,338)
Defined retirement benefit plans (1,117) (1,094) (9,887)
Share of other comprehensive income (loss) in associates (6) 4(54)
Total other comprehensive income (loss) (50,494) 21,778 (446,853)
Comprehensive income Y (19,048) Y 75,548 $ (168,573)
Comprehensive income attributable to:
Owners of the Company Y (19,437) Y 75,660 $ (172,012)
Non-controlling interests 388 (112) 3,438
Millions of yen
Thousands of
U.S. dollars
Year ended
Year ended
Year ended
Millions of yen
Thousands of
U.S. dollars
March 31,
March 31,
March 31,
2016
2015
2016
Gain (Loss) on sales and disposals of property, plant and
equipment, net
Yen
Yen
U.S. dollars
2016
2015
2016
Year ended
Year ended
Year ended
March 31,
March 31,
March 31,
3