Brother International 2016 Annual Report Download - page 7
Download and view the complete annual report
Please find page 7 of the 2016 Brother International annual report below. You can navigate through the pages in the report by either clicking on the pages listed below, or by using the keyword search tool below to find specific information within the annual report.-
 1
1 -
 2
2 -
 3
3 -
 4
4 -
 5
5 -
 6
6 -
 7
7 -
 8
8 -
 9
9
 |
 |
B I, .
ay 9, 6
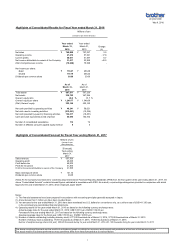
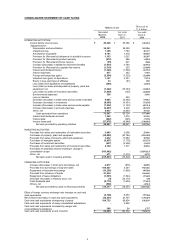
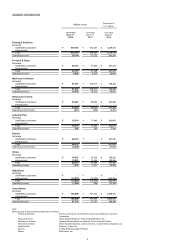
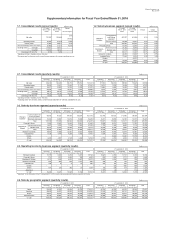
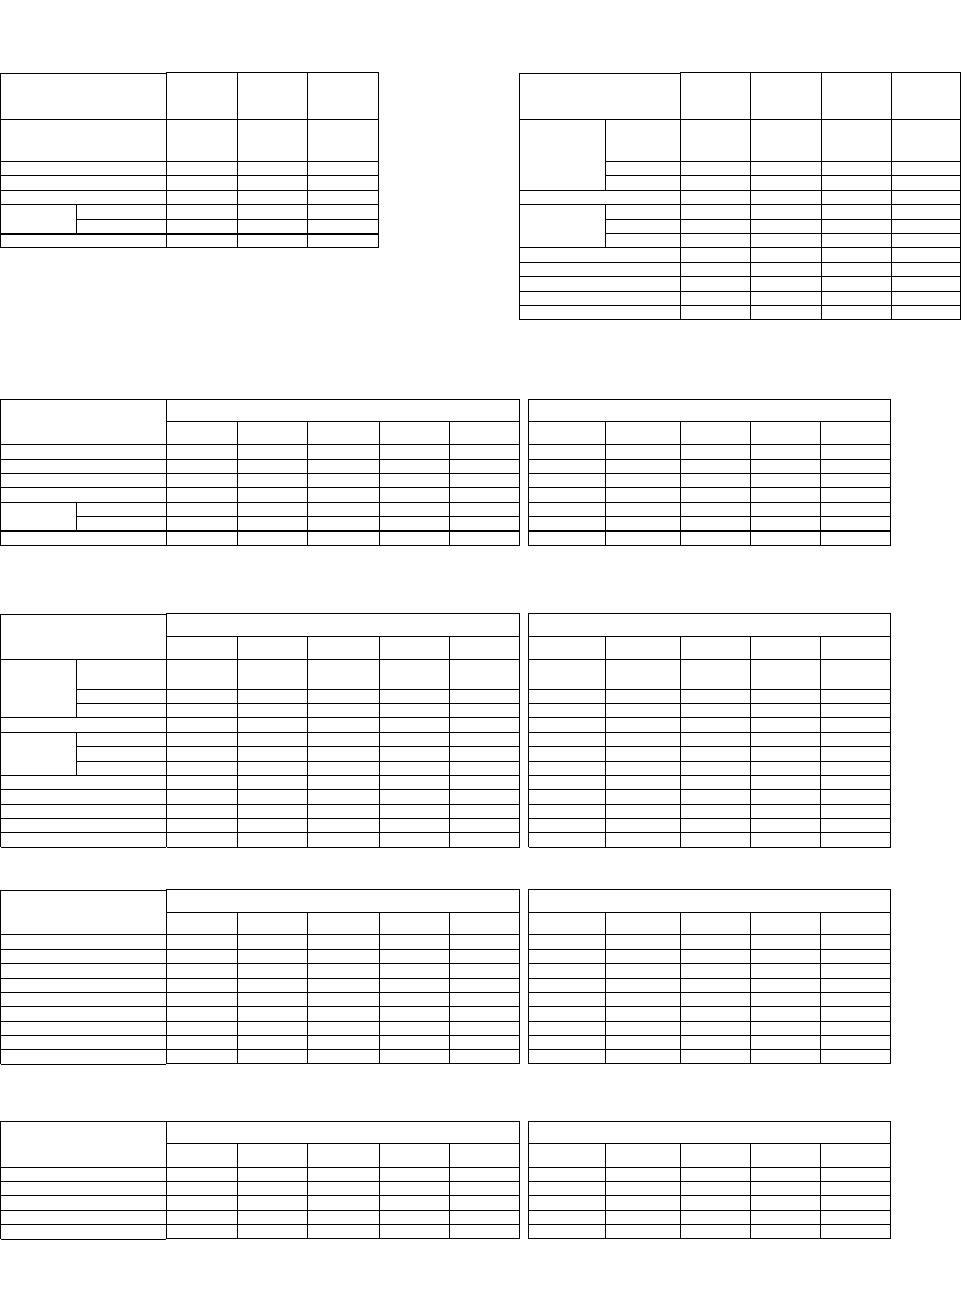
Supplementary Information for Fiscal Year Ended March 31, 2016
1-1. Consolidated results (annual results) (Millions of yen) (Millions of yen)
FY ended FY ended Change FY ended FY ended
Mar 31, 2015 Mar 31, 2016 Mar 31, 2015 Mar 31, 2016 Change Change
results results results results w/o forex impact
5.5%
(+4.0%)
Operating income 57,541 47,276 -17.8% Electronic stationery 52,459 55,273 5.4% 2.9%
Current profits 51,557 48,611 -5.7% Total 474,257 476,767 0.5% -0.6%
53,969 31,017 -42.5% 51,445 52,797 2.6% 0.0%
Exchange rates Yen-USD 110.03 120.16 - Industrial sewing machines 27,302 30,758 12.7% 6.3%
Yen-EUR 138.68 132.36 - Machine tools 73,314 50,648 -30.9% -32.8%
Operating profit ratio (%) 8.1% 6.3% - Total 100,617 81,407 -19.1% -22.2%
48,950 53,697 9.7% 9.5%
* "Exchange rates" are the rates used to convert financial statements of overseas subsidiaries into yen. 17,443 18,314 5.0% 3.4%
- 48,312 - -
14,524 14,591 0.5% 0.4%
707,237 745,888 5.5% 4.0%
2-1. Consolidated results (quarterly results) (Millions of yen)
1st Quarter 2nd Quarter 3rd Quarter 4th Quarter Total 1st Quarter 2nd Quarter 3rd Quarter 4th Quarter Total
(Apr to Jun 2014) (Jul to Sep 2014) (Oct to Dec 2014) (Jan to Mar 2015) (Apr to Jun 2015) (Jul to Sep 2015) (Oct to Dec 2015) (Jan to Mar 2016)
Net sales 160,436 164,236 196,750 185,814 707,237 177,050 194,016 198,596 176,225 745,888
Operating income 16,490 13,471 15,845 11,734 57,541 15,273 9,335 14,929 7,738 47,276
Current profits 14,817 12,820 14,760 9,160 51,557 15,985 8,895 16,423 7,306 48,611
29,388 7,733 10,931 5,915 53,969 6,914 6,323 12,105 5,673 31,017
Exchange rates Yen-USD 102.14 104.35 114.39 119.56 110.03 121.34 121.91 121.07 116.95 120.16
Yen-EUR 140.01 137.94 142.60 136.10 138.68 133.86 136.00 132.37 128.94 132.36
Operating profit ratio (%) 10.3% 8.2% 8.1% 6.3% 8.1% 8.6% 4.8% 7.5% 4.4% 6.3%
* Operating profit ratio = Operating income / Net sales
* "Exchange rates" are the rates used to convert financial statements of overseas subsidiaries into yen.
(Millions of yen)
1st Quarter 2nd Quarter 3rd Quarter 4th Quarter Total 1st Quarter 2nd Quarter 3rd Quarter 4th Quarter Total
(Apr to Jun 2014) (Jul to Sep 2014) (Oct to Dec 2014) (Jan to Mar 2015) (Apr to Jun 2015) (Jul to Sep 2015) (Oct to Dec 2015) (Jan to Mar 2016)
Communications and
Printing equipment 95,855 97,327 118,680 109,934 421,797 103,705 105,033 113,086 99,668 421,494
Electronic stationery 11,943 12,697 13,912 13,906 52,459 13,211 14,059 14,185 13,817 55,273
Total 107,798 110,025 132,592 123,840 474,257 116,917 119,092 127,271 113,485 476,767
9,366 12,481 16,646 12,951 51,445 10,988 14,231 16,252 11,323 52,797
Industrial sewing machines 6,667 6,332 7,018 7,283 27,302 7,776 7,440 8,426 7,115 30,758
Machine tools 18,310 15,576 19,452 19,975 73,314 22,558 11,566 7,984 8,538 50,648
Total 24,978 21,909 26,471 27,258 100,617 30,335 19,006 16,410 15,654 81,407
10,687 11,839 12,601 13,821 48,950 11,584 15,546 13,674 12,891 53,697
4,198 4,414 4,289 4,540 17,443 4,504 4,547 4,574 4,688 18,314
- - - - - - 16,824 16,408 15,079 48,312
3,406 3,567 4,149 3,402 14,524 2,719 4,766 4,004 3,102 14,591
G. total 160,436 164,236 196,750 185,814 707,237 177,050 194,016 198,596 176,225 745,888
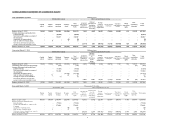
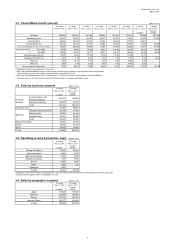
2-3. Operating income by business segment (quarterly results) (Millions of yen)
1st Quarter 2nd Quarter 3rd Quarter 4th Quarter Total 1st Quarter 2nd Quarter 3rd Quarter 4th Quarter Total
(Apr to Jun 2014) (Jul to Sep 2014) (Oct to Dec 2014) (Jan to Mar 2015) (Apr to Jun 2015) (Jul to Sep 2015) (Oct to Dec 2015) (Jan to Mar 2016)
Printing & Solutions 11,778 9,290 9,252 5,401 35,722 10,927 4,753 11,737 6,766 34,184
Personal & Home 712 1,273 2,202 740 4,929 653 1,932 1,771 490 4,846
Machinery & Solution 4,175 3,348 4,233 4,461 16,219 5,852 2,064 1,692 748 10,356
Network & Contents -975 -666 -232 1,017 -856 -765 58 163 265 -277
184 15 -4 91 286 224 152 240 262 880
- - - - - - -128 -955 -939 -2,024
Others 614 210 392 21 1,239 159 538 317 260 1,275
Adjustment - - - - - -1,777 -35 -37 -114 -1,965
G. total 16,490 13,471 15,845 11,734 57,541 15,273 9,335 14,929 7,738 47,276
*"Adjustment" for the first quarter of the FY ending March 31, 2016 is mainly costs associated with the share acquisition of Domino.
2-4. Sales by geographic segment (quarterly results) (Millions of yen)
1st Quarter 2nd Quarter 3rd Quarter 4th Quarter Total 1st Quarter 2nd Quarter 3rd Quarter 4th Quarter Total
(Apr to Jun 2014) (Jul to Sep 2014) (Oct to Dec 2014) (Jan to Mar 2015) (Apr to Jun 2015) (Jul to Sep 2015) (Oct to Dec 2015) (Jan to Mar 2016)
Japan 39,990 41,352 48,264 48,755 179,019 46,354 46,390 42,335 40,546 175,627
Americas 49,682 54,631 65,903 60,319 230,536 57,649 67,576 69,101 58,217 252,546
Europe 39,661 39,161 48,444 45,648 172,914 40,548 45,047 55,271 50,668 191,536
Asia and Others 31,102 29,091 34,137 31,092 124,766 32,496 35,001 31,886 26,792 126,177
G. total 160,436 164,236 196,750 185,814 707,237 177,050 194,016 198,596 176,225 745,888
FY ended Mar 31, 2016
FY ended Mar 31, 2016
FY ended Mar 31, 2016
FY ended Mar 31, 2016
Industrial Part
Domino
Domino
Domino
FY ended Mar 31, 2015
1-2. Sales by business segment (annual results)
Printing &
Solutions
Personal & Home
421,494 -0.1%
( w/o forex impact )
Communicat ions
and Printing
equipment
Machinery &
Solution
Network & Contents
-1.0%707,237 745,888
* Operating profit ratio = Operating income / Net sales
Net sales
Net income Attributable to owners of the company
Personal & Home
FY ended Mar 31, 2015
FY ended Mar 31, 2015
421,797
2-2. Sales by business segment (quarterly results)
Industrial Parts
Industrial Part
Others
G. total
Machinery &
Solution
FY ended Mar 31, 2015
Others
Printing &
Solutions
Network & Contents
Net income Attributable to owners of the company
1