Brother International 2016 Annual Report Download
Download and view the complete annual report
Please find the complete 2016 Brother International annual report below. You can navigate through the pages in the report by either clicking on the pages listed below, or by using the keyword search tool below to find specific information within the annual report.-
 1
1 -
 2
2 -
 3
3 -
 4
4 -
 5
5 -
 6
6 -
 7
7 -
 8
8 -
 9
9
 |
 |

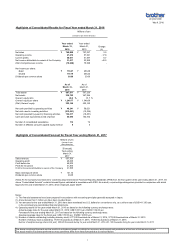
Highlights of Consolidated Results for Fiscal Year ended March 31, 2016
Change
(%)
Net sales Y 745,888 Y 707,237 5.5
Operating income 47,276 57,541 -17.8
Current profits 48,611 51,557 -5.7
Net income attributable to owners of the Company 31,017 53,969 -42.5
(Ref.) Comprehensive income (19,048) 75,548 -
Net income per share:
Basic Y 119.47 Y 206.68
Diluted 119.19 206.24
Dividends per common share 36.00 30.00
Total assets Y 667,811 Y 567,230
Net assets 339,722 367,284
Owners' equity ratio 48.2 % 61.7
%
Owners' equity per share Y 1,240.77 Y 1,348.69
(Ref.) Owners' equity 322,146 350,162
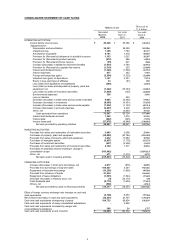
Net cash provided by operating activities Y 49,241 Y 58,021
Net cash used in investing activities (215,091) (15,326)
Net cash provided by (used in) financing activities 134,317 (18,451)
Cash and cash equivalents at end of period 66,690 104,732
Number of consolidated subsidiaries 114 74
Number of affiliates using the applied equity method
85
Highlights of Consolidated Forecast for Fiscal Year ending March 31, 2017
Millions of yen
Sales revenue Y 657,500
Operating profit 45,000
Profit before tax 45,000
Profit for the period 31,800
Profit for the period attributable to owners of the Company
31,500
Basic earnings per share Y 121.32
Dividends per common share 36.00
Notes:
1) The financial statements have been prepared in accordance with accounting principles generally accepted in Japan.
2) Amounts less than 1 million yen have been rounded down.
3) Yen amounts for the year ended March 31, 2016 have been translated into U.S. dollars for convenience only, at a uniform rate of US$1=113.00 yen,
in the accompanying consolidated financial statements.
4) Operating results for the year ended March 31, 2016 are based on the following currency exchange rates:
Actual average rates for the year ended March 31, 2016: US$=120.16 yen, EURO=132.36 yen
Forecasts for the year ending March 31, 2017 are based on the following currency exchange rates:
Assumed average rates for the fiscal year: US$=110.00 yen, EURO=125.00 yen
5) Number of shares outstanding (including treasury stock): 277,535 thousands as of March 31, 2016, 277,535 thousands as of March 31, 2015
Number of treasury stock outstanding: 17,901 thousands as of March 31, 2016, 17,903 thousands as of March 31, 2015
Number of weighted average shares (full year): 259,629 thousands during the year ended March 31, 2016, 261,125 thousands during the year ended March 31, 2015
The above-mentioned forecasts are the results of estimations based on outlook for economic environment and predictions at the time of this announcement.
The actual results of business performance may sometimes differ from these forecasts due to various factors.
(Note) As the Company has resolved to voluntarily adopt International Financial Reporting Standards (IFRS) from the first quarter of the year ending March 31, 2017, the
above “Consolidated forecast” contains forecast figures calculated in accordance with IFRS. As a result, no percentage changes are provided in comparison with actual
figures for the year ended March 31, 2016, which employed Japan GAAP.
[Forecast]
Year ending
March 31,
2017
(except for per
share amounts)
March 31,
March 31,
2016
2015
2016
2015
As of
As of
May 9, 2016
Millions of yen
(except for per share amounts)
March 31,
March 31,
Year ended
Year ended
1
Table of contents
-
Page 1
... period 31,800 Profit for the period attributable to owners of the Company 31,500 Basic earnings per share Dividends per common share Y 121.32 36.00 (Note) As the Company has resolved to voluntarily adopt International Financial Reporting Standards (IFRS) from the first quarter of the year ending... -
Page 2
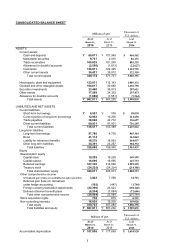
... Other long-term liabilities Total liabilities Equity Shareholders' equity Capital stock Capital surplus Retained earnings Treasury stock Total shareholders' equity Other comprehensive income Unrealized gain (loss) on available-for-sale securities 2015 2016 Y 69,671 9,737 100,029 (2,556) 126... -
Page 3
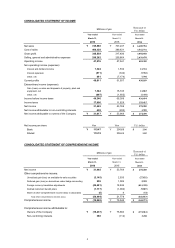
... of yen Year ended March 31, Year ended March 31, Thousands of U.S. dollars Year ended March 31, 2016 Net sales Cost of sales Gross profit Selling, general and administrative expenses Operating income Non-operating income (expenses): Interest and dividend income Interest expenses Other, net 2015... -
Page 4
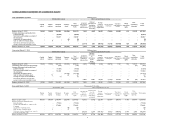
... 2016 Year ended March 31, 2015 Shareholders' equity Total shareholders' equity Millions of yen Other comprehensive income Unrealized on gain (loss) on available-for- derivatives under sale securities Deferred gain (loss) Capital stock Capital surplus Retained earnings Treasury stock Balance... -
Page 5
... expenses Foreign exchange loss (gain) Valuation loss (gain) on derivatives Equity in loss (earnings) of affiliates Loss (Gain) from liquidation of subsidiaries Loss (Gain) on sales and disposals of property, plant and equipment, net Loss (Gain) on sales of investment securities Environmental... -
Page 6
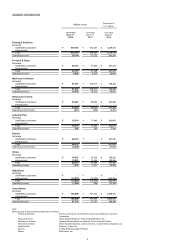
..., Typewriters Personal & Home Home Sewing Machines, Home Cutting Machines, etc. Machinery & Solution Industrial Sewing Machines, Machine Tools, Garment Printers Network & Contents Online Karaoke Systems, Content Services, Content-delivery Systems, etc. Industrial Part Reducers, Gears, etc. Domino... -
Page 7
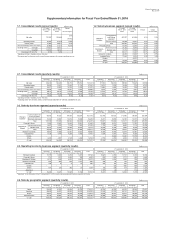
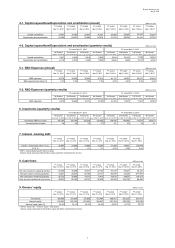
... machines Personal & Home Machinery & Solution Machine tools Total Network & Contents Industrial Part Domino Others G. total 2-3. Operating income by business segment (quarterly results) FY ended Mar 31, 2015 1st Quarter (Apr to Jun 2014) (Millions of yen) FY ended Mar 31, 2016 4th Quarter... -
Page 8
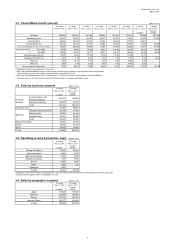
...Machine tools Industrial Parts Total Network & Contents Domino Others G. total 3-3. Operating income by business segm FY ended Mar 31, 2016 (Millions of yen) FY ending Mar 31, 2017 forecast < IFRS> Printing & Solutions Personal & Home Machinery & Solution Network & Contents Domino... -
Page 9
...2016 2nd Quarter 3rd Quarter 4th Quarter as of Jun 30, 2015 as of Sep 30, 2015 as of Dec 31, 2015 as of Mar 31, 2016 Inventories (Millions of yen) Inventories/cost of sales 107,103 3.6 125,145 4.2 129,229 3.5 122,425 3.7 138,435 4.3 139,966 4.0 137,517 3.9 126,871 4.1 7. Interest - bearing...