Blizzard 2011 Annual Report Download - page 7
Download and view the complete annual report
Please find page 7 of the 2011 Blizzard annual report below. You can navigate through the pages in the report by either clicking on the pages listed below, or by using the keyword search tool below to find specific information within the annual report.-
 1
1 -
 2
2 -
 3
3 -
 4
4 -
 5
5 -
 6
6 -
 7
7 -
 8
8 -
 9
9 -
 10
10 -
 11
11 -
 12
12 -
 13
13 -
 14
14 -
 15
15 -
 16
16 -
 17
17 -
 18
18 -
19
-
20
-
21
-
22
-
23
-
24
-
25
-
26
-
27
-
28
-
29
-
30
-
31
-
32
-
33
-
34
-
35
-
36
-
37
-
38
-
39
-
40
-
41
-
42
-
43
-
44
-
45
-
46
-
47
-
48
-
49
-
50
-
51
-
52
-
53
-
54
-
55
-
56
-
57
-
58
-
59
-
60
-
61
-
62
-
63
-
64
-
65
-
66
-
67
-
68
-
69
-
70
-
71
-
72
-
73
-
74
-
75
-
76
-
77
-
78
-
79
-
80
-
81
-
82
-
83
-
84
-
85
-
86
-
87
-
88
-
89
-
90
-
91
-
92
-
93
-
94
 |
 |

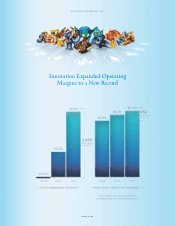
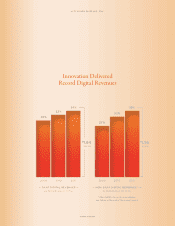
2009
25.8%
2010
28.5%
2011
30.3%
— GAAP OPERATING MARGINS — — NON-GAAP OPERATING MARGINS(1) —
450
BASIS POINT
INCREASE
Innovation Expanded Operating
Margins to a New Record
PAGE FI VE
(1)Non-GAAP—for a full reconciliation
see tables at the end of the annual report.
(0.6%)
2009
10.5%
2010
27.9%
2011
2,850
BASIS POINT
INCREASE
ACTIVISION BLIZZARD, INC.