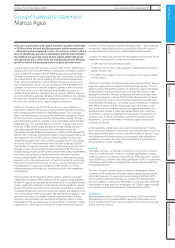
Barclays 2010 Annual Report Download - page 19
Download and view the complete annual report
Please find page 19 of the 2010 Barclays annual report below. You can navigate through the pages in the report by either clicking on the pages listed below, or by using the keyword search tool below to find specific information within the annual report.
Financial strength
Barclays overall financial strength remains of central importance to
the Group. Following the financial crisis we took an early decision
to get ahead of regulatory change and manage our business to higher
standards than those required by current regulation. We did this
because we recognised the importance of providing stability at a time
of extreme uncertainty.
Capital Management
At 31st December 2010, on a Basel II basis, the Group’s Core Tier 1 ratio
was 10.8% (2009: 10.0%) and the Tier 1 ratio was 13.5% (2009: 13.0%),
representing a strengthening of our capital ratios ahead of the effects
of expected regulatory capital changes. Retained profit contributed
approximately 70bps to the increase in the Core Tier 1 ratio. Other
movements in Core Tier 1 included the exercise of warrants in February
and October 2010, which generated shareholders’ equity of £1.5bn,
contributing approximately 40bps to the Core Tier 1 ratio. The movement
in the fair value of the Group’s holding in BlackRock, Inc. resulted in an
adverse impact of approximately 20bps on the Core Tier 1 ratio over the year.
Capital Strength
% Regulatory capital ratios
07 08 09 10
4.7
7.6
5.6
8.6
10.0
13.0
10.8
13.5
Tier 1
Core Tier 1
Adjusted Gross Leverage
Barclays continues to operate within limits and targets for balance sheet
usage as part of its balance sheet management activities. The adjusted
gross leverage was 20x as at 31st December 2010 (2009: 20x) principally
as a result of a £3.9bn increase in Tier 1 Capital to £53.5bn offset by the
impact of a £84.6bn increase in adjusted total tangible assets. At month
ends during 2010 the ratio moved within a range from 20x to 24x, with
fluctuations arising as a result of normal trading activities, primarily due
to increases in reverse repurchase trading and changes in holdings of
trading portfolio assets.
The Basel Committee of Banking Supervisors (BCBS) issued final
guidelines for ‘Basel III: a global regulatory framework for more resilient
banks and banking systems’ in December 2010. The guidelines include
a proposed leverage metric, to be implemented by national supervisors
in parallel run from 1st January 2013 (migrating to a Pillar 1 measure by
2018). Based on our interpretation of the current BCBS proposals the
Group’s Basel III leverage ratio as at 31st December 2010 would be
within the proposed limit of 33x.
Liquidity and Funding
The Group liquidity pool as at 31st December 2010 was £154bn gross
(2009: £127bn) and comprised the following cash and unencumbered
assets (of which £140bn are FSA eligible). The Group maintains additional
liquid assets to support ongoing business requirements such as payment
services. The cost of the Group liquidity pool for 2010 is approximately
£900m, an increase on the previous year. This cost has been allocated on
the basis of the projected stress outflows arising in each relevant business.
Cash and
deposits
with central
banks
£bn
Government
guaranteed
bonds
£bn
Governments
and
supranational
bonds
£bn
Other
available
liquidity
£bn
Total
£bn
As at 31.12.10 96 1 46 11 154
As at 31.12.09 81 3 31 12 127
Since June 2010, the Group has reported its liquidity position against
backstop Individual Liquidity Guidance (ILG) provided by the FSA.
Calibration of the Group’s Liquidity Framework anticipated final FSA
rules and is therefore broadly consistent with current FSA standards.
The Basel Committee of Banking Supervisors (BCBS) issued its final
guidelines for liquidity risk management, standards and monitoring in
December 2010. These guidelines include a short term liquidity stress
metric (the Liquidity Coverage Ratio (LCR)) and a longer term liquidity
metric (the Net Stable Funding Ratio (NSFR)). The BCBS guidelines have
yet to be implemented into European and UK law and therefore remain
subject to refinement and change.
However, the Group monitors compliance against these BCBS metrics
and the FSA is expected to bring its ILG metrics into line with the Basel LCR
over time. Applying the expected BCBS guidelines to the Group’s liquidity
position as at 31st December 2010, the relevant ratios were estimated at
80% of the LCR requirement and 94% of the NSFR requirement.
Credit Ratings
In addition to monitoring and managing key metrics related to the financial
strength of Barclays, we also subscribe to independent credit rating agency
reviews by Standard & Poor’s, Moody’s Fitch and DBRS. These ratings assess
the credit worthiness of Barclays and are based on reviews of a broad range
of business and financial attributes including; risk management processes
and procedures; capital strength, earnings, funding, liquidity, accounting,
and governance.
As at 31.12.10 Barclays PLC Barclays Bank PLC
Standard & Poor’s
Long Term A+ AA-
Short Term A- 1 A- 1+
Moody’s
Long Term A1 Aa3
Short Term P-1 P-1
BFSR n/a C(Stable)
Fitch
Long Term AA- AA-
Short Term F1+ F1+
DBRS
Long Term AA (High)
Short Term R-1 (High)
Barclays PLC Annual Report 2010 www.barclays.com/annualreport10 17
Performance Risk management and governance Financial statements Shareholder informationStrategyAbout Barclays


