Barclays 2006 Annual Report Download - page 16
Download and view the complete annual report
Please find page 16 of the 2006 Barclays annual report below. You can navigate through the pages in the report by either clicking on the pages listed below, or by using the keyword search tool below to find specific information within the annual report.-
 1
1 -
2
-
3
-
4
-
5
-
 6
6 -
 7
7 -
 8
8 -
 9
9 -
 10
10 -
 11
11 -
 12
12 -
 13
13 -
 14
14 -
 15
15 -
 16
16 -
 17
17 -
 18
18 -
 19
19 -
 20
20 -
 21
21 -
 22
22 -
 23
23 -
 24
24 -
 25
25 -
 26
26 -
27
-
28
-
29
-
30
-
31
-
32
-
33
-
34
-
35
-
36
-
37
-
38
-
39
-
40
-
41
-
42
-
43
-
44
-
45
-
46
-
47
-
48
-
49
-
50
-
51
-
52
-
53
-
54
-
55
-
56
-
57
-
58
-
59
-
60
-
61
-
62
-
63
-
64
-
65
-
66
-
67
-
68
-
69
-
70
-
71
-
72
-
73
-
74
-
75
-
76
-
77
-
78
-
79
-
80
-
81
-
82
-
83
-
84
-
85
-
86
-
87
-
88
-
89
-
90
-
91
-
92
-
93
-
94
-
95
-
96
-
97
-
98
-
99
-
100
-
101
-
102
-
103
-
104
-
105
-
106
-
107
-
108
-
109
-
110
-
111
-
112
-
113
-
114
-
115
-
116
-
117
-
118
-
119
-
120
-
121
-
122
-
123
-
124
-
125
-
126
-
127
-
128
-
129
-
130
-
131
-
132
-
133
-
134
-
135
-
136
-
137
-
138
-
139
-
140
-
141
-
142
-
143
-
144
-
145
-
146
-
147
-
148
-
149
-
150
-
151
-
152
-
153
-
154
-
155
-
156
-
157
-
158
-
159
-
160
-
161
-
162
-
163
-
164
-
165
-
166
-
167
-
168
-
169
-
170
-
171
-
172
-
173
-
174
-
175
-
176
-
177
-
178
-
179
-
180
-
181
-
182
-
183
-
184
-
185
-
186
-
187
-
188
-
189
-
190
-
191
-
192
-
193
-
194
-
195
-
196
-
197
-
198
-
199
-
200
-
201
-
202
-
203
-
204
-
205
-
206
-
207
-
208
-
209
-
210
-
211
-
212
-
213
-
214
-
215
-
216
-
217
-
218
-
219
-
220
-
221
-
222
-
223
-
224
-
225
-
226
-
227
-
228
-
229
-
230
-
231
-
232
-
233
-
234
-
235
-
236
-
237
-
238
-
239
-
240
-
241
-
242
-
243
-
244
-
245
-
246
-
247
-
248
-
249
-
250
-
251
-
252
-
253
-
254
-
255
-
256
-
257
-
258
-
259
-
260
-
261
-
262
-
263
-
264
-
265
-
266
-
267
-
268
-
269
-
270
-
271
-
272
-
273
-
274
-
275
-
276
-
277
-
278
-
279
-
280
-
281
-
282
-
283
-
284
-
285
-
286
-
287
-
288
-
289
-
290
-
291
-
292
-
293
-
294
-
295
-
296
-
297
-
298
-
299
-
300
-
301
-
302
-
303
-
304
-
305
-
306
-
307
-
308
-
309
-
310
 |
 |

Barclays PLC
Annual Report 2006
12
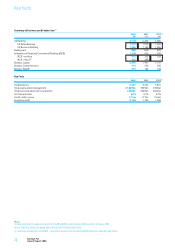
Consolidated balance sheet summary – IFRS
As at 31st December
2006 2005 2004(a)
£m £m £m
Assets
Cash and other short-term funds 9,753 5,807 3,525
Treasury bills and other eligible bills n/a n/a 6,658
Trading and financial assets designated at fair value 292,464 251,820 n/a
Derivative financial instruments 138,353 136,823 n/a
Debt securities and equity shares n/a n/a 141,710
Loans and advances to banks 30,926 31,105 80,632
Loans and advances to customers 282,300 268,896 262,409
Available for sale investments 51,703 53,497 n/a
Reverse repurchase agreements and cash collateral on securities borrowed 174,090 160,398 n/a
Property, plant and equipment 2,492 2,754 2,282
Other assets 14,706 13,257 40,965
Total assets 996,787 924,357 538,181
Liabilities
Deposits and items in the course of collection due to banks 81,783 77,468 112,229
Customer accounts 256,754 238,684 217,492
Trading and financial liabilities designated at fair value 125,861 104,949 n/a
Liabilities to customers under investment contracts 84,637 85,201 n/a
Derivative financial instruments 140,697 137,971 n/a
Debt securities in issue 111,137 103,328 83,842
Repurchase agreements and cash collateral on securities lent 136,956 121,178 n/a
Insurance contract liabilities, including unit-linked liabilities 3,878 3,767 8,377
Subordinated liabilities 13,786 12,463 12,277
Other liabilities 13,908 14,918 87,200
Total liabilities 969,397 899,927 521,417
Shareholders’ equity
Shareholders’ equity excluding minority interests 19,799 17,426 15,870
Minority interests 7,591 7,004 894
Total shareholders’ equity 27,390 24,430 16,764
Total liabilities and shareholders’ equity 996,787 924,357 538,181
Risk weighted assets and capital ratios
Risk weighted assets 297,833 269,148 218,601
Tier 1 ratio(b) 7.7% 7.0% 7.6%
Risk asset ratio(b) 11.7% 11.3% 11.5%
Selected financial statistics
Net asset value per ordinary share 303p 269p 246p
Year-end United States Dollar exchange rate used in preparing the accounts 1.96 1.72 1.92
Year-end Euro exchange rate used in preparing the accounts 1.49 1.46 1.41
Year-end Rand exchange rate used in preparing the accounts 13.71 10.87 10.86
Note 60 to the accounts provides a reconciliation of profit attributable to equity holders of the parent and shareholders’ equity between the amounts
calculated under IFRS and US GAAP.
The financial information above is extracted from the published accounts for the last two years. This information should be read together with, and is
qualified by reference to, the accounts and Notes included in this report.
Financial data
Notes
(a) Does not reflect the application of IAS 32, IAS 39 and IFRS 4 which became effective from 1st January 2005.
(b) Capital ratios for 2004 are based on UK GAAP and have not been restated as these remain as reported to the Financial Services Authority (FSA). As at 1st January
2005 the tier 1 ratio was 7.1% and the risk asset ratio was 11.8% reflecting the impact of IFRS including the adoption of IAS 32, IAS 39 and IFRS 4.