Barclays 2006 Annual Report Download - page 14
Download and view the complete annual report
Please find page 14 of the 2006 Barclays annual report below. You can navigate through the pages in the report by either clicking on the pages listed below, or by using the keyword search tool below to find specific information within the annual report.-
 1
1 -
2
-
3
-
 4
4 -
 5
5 -
 6
6 -
 7
7 -
 8
8 -
 9
9 -
 10
10 -
 11
11 -
 12
12 -
 13
13 -
 14
14 -
 15
15 -
 16
16 -
 17
17 -
 18
18 -
 19
19 -
 20
20 -
 21
21 -
 22
22 -
 23
23 -
 24
24 -
25
-
26
-
27
-
28
-
29
-
30
-
31
-
32
-
33
-
34
-
35
-
36
-
37
-
38
-
39
-
40
-
41
-
42
-
43
-
44
-
45
-
46
-
47
-
48
-
49
-
50
-
51
-
52
-
53
-
54
-
55
-
56
-
57
-
58
-
59
-
60
-
61
-
62
-
63
-
64
-
65
-
66
-
67
-
68
-
69
-
70
-
71
-
72
-
73
-
74
-
75
-
76
-
77
-
78
-
79
-
80
-
81
-
82
-
83
-
84
-
85
-
86
-
87
-
88
-
89
-
90
-
91
-
92
-
93
-
94
-
95
-
96
-
97
-
98
-
99
-
100
-
101
-
102
-
103
-
104
-
105
-
106
-
107
-
108
-
109
-
110
-
111
-
112
-
113
-
114
-
115
-
116
-
117
-
118
-
119
-
120
-
121
-
122
-
123
-
124
-
125
-
126
-
127
-
128
-
129
-
130
-
131
-
132
-
133
-
134
-
135
-
136
-
137
-
138
-
139
-
140
-
141
-
142
-
143
-
144
-
145
-
146
-
147
-
148
-
149
-
150
-
151
-
152
-
153
-
154
-
155
-
156
-
157
-
158
-
159
-
160
-
161
-
162
-
163
-
164
-
165
-
166
-
167
-
168
-
169
-
170
-
171
-
172
-
173
-
174
-
175
-
176
-
177
-
178
-
179
-
180
-
181
-
182
-
183
-
184
-
185
-
186
-
187
-
188
-
189
-
190
-
191
-
192
-
193
-
194
-
195
-
196
-
197
-
198
-
199
-
200
-
201
-
202
-
203
-
204
-
205
-
206
-
207
-
208
-
209
-
210
-
211
-
212
-
213
-
214
-
215
-
216
-
217
-
218
-
219
-
220
-
221
-
222
-
223
-
224
-
225
-
226
-
227
-
228
-
229
-
230
-
231
-
232
-
233
-
234
-
235
-
236
-
237
-
238
-
239
-
240
-
241
-
242
-
243
-
244
-
245
-
246
-
247
-
248
-
249
-
250
-
251
-
252
-
253
-
254
-
255
-
256
-
257
-
258
-
259
-
260
-
261
-
262
-
263
-
264
-
265
-
266
-
267
-
268
-
269
-
270
-
271
-
272
-
273
-
274
-
275
-
276
-
277
-
278
-
279
-
280
-
281
-
282
-
283
-
284
-
285
-
286
-
287
-
288
-
289
-
290
-
291
-
292
-
293
-
294
-
295
-
296
-
297
-
298
-
299
-
300
-
301
-
302
-
303
-
304
-
305
-
306
-
307
-
308
-
309
-
310
 |
 |

Barclays PLC
Annual Report 2006
10
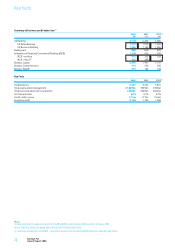
Consolidated income statement summary – IFRS
For the year ended 31st December
2006 2005 2004(a)
£m £m £m
Continuing operations
Net interest income 9,143 8,075 6,833
Net fee and commission income 7,177 5,705 4,847
Principal transactions 4,576 3,179 2,514
Net premiums from insurance contracts 1,060 872 1,042
Other income 214 147 131
Total income 22,170 17,978 15,367
Net claims and benefits paid on insurance contracts (575) (645) (1,259)
Total income net of insurance claims 21,595 17,333 14,108
Impairment charges (2,154) (1,571) (1,093)
Net income 19,441 15,762 13,015
Operating expenses (12,674) (10,527) (8,536)
Share of post-tax results of associates and joint ventures 46 45 56
Profit on disposal of subsidiaries, associates and joint ventures 323 –45
Profit before tax 7,136 5,280 4,580
Tax (1,941) (1,439) (1,279)
Profit after tax 5,195 3,841 3,301
Profit attributable to minority interests 624 394 47
Profit attributable to equity holders of the parent 4,571 3,447 3,254
5,195 3,841 3,301
Selected financial statistics
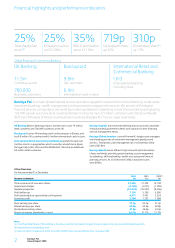
Basic earnings per share 71.9p 54.4p 51.0p
Diluted earnings per share 69.8p 52.6p 49.8p
Dividends per ordinary share 31.0p 26.6p 24.0p
Dividend payout ratio 43.1% 48.9% 47.1%
Profit attributable to the equity holders of the parent as a percentage of:
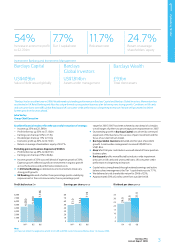
average shareholders’ equity 24.7% 21.1% 21.7%
average total assets 0.4% 0.4% 0.5%
Cost:income ratio 59% 61% 61%
Cost:net income ratio 65% 67% 66%
Average United States Dollar exchange rate used in preparing the accounts 1.84 1.82 1.83
Average Euro exchange rate used in preparing the accounts 1.47 1.46 1.47
Average Rand exchange rate used in preparing the accounts 12.47 11.57 11.83
The financial information above is extracted from the published accounts for the last two years. This information should be read together with, and
is qualified by reference to, the accounts and Notes included in this report.
Financial data
Note
(a) Does not reflect the application of IAS 32, IAS 39 and IFRS 4 which became effective from 1st January 2005.