Barclays 2006 Annual Report Download - page 15
Download and view the complete annual report
Please find page 15 of the 2006 Barclays annual report below. You can navigate through the pages in the report by either clicking on the pages listed below, or by using the keyword search tool below to find specific information within the annual report.-
 1
1 -
2
-
3
-
4
-
 5
5 -
 6
6 -
 7
7 -
 8
8 -
 9
9 -
 10
10 -
 11
11 -
 12
12 -
 13
13 -
 14
14 -
 15
15 -
 16
16 -
 17
17 -
 18
18 -
 19
19 -
 20
20 -
 21
21 -
 22
22 -
 23
23 -
 24
24 -
 25
25 -
26
-
27
-
28
-
29
-
30
-
31
-
32
-
33
-
34
-
35
-
36
-
37
-
38
-
39
-
40
-
41
-
42
-
43
-
44
-
45
-
46
-
47
-
48
-
49
-
50
-
51
-
52
-
53
-
54
-
55
-
56
-
57
-
58
-
59
-
60
-
61
-
62
-
63
-
64
-
65
-
66
-
67
-
68
-
69
-
70
-
71
-
72
-
73
-
74
-
75
-
76
-
77
-
78
-
79
-
80
-
81
-
82
-
83
-
84
-
85
-
86
-
87
-
88
-
89
-
90
-
91
-
92
-
93
-
94
-
95
-
96
-
97
-
98
-
99
-
100
-
101
-
102
-
103
-
104
-
105
-
106
-
107
-
108
-
109
-
110
-
111
-
112
-
113
-
114
-
115
-
116
-
117
-
118
-
119
-
120
-
121
-
122
-
123
-
124
-
125
-
126
-
127
-
128
-
129
-
130
-
131
-
132
-
133
-
134
-
135
-
136
-
137
-
138
-
139
-
140
-
141
-
142
-
143
-
144
-
145
-
146
-
147
-
148
-
149
-
150
-
151
-
152
-
153
-
154
-
155
-
156
-
157
-
158
-
159
-
160
-
161
-
162
-
163
-
164
-
165
-
166
-
167
-
168
-
169
-
170
-
171
-
172
-
173
-
174
-
175
-
176
-
177
-
178
-
179
-
180
-
181
-
182
-
183
-
184
-
185
-
186
-
187
-
188
-
189
-
190
-
191
-
192
-
193
-
194
-
195
-
196
-
197
-
198
-
199
-
200
-
201
-
202
-
203
-
204
-
205
-
206
-
207
-
208
-
209
-
210
-
211
-
212
-
213
-
214
-
215
-
216
-
217
-
218
-
219
-
220
-
221
-
222
-
223
-
224
-
225
-
226
-
227
-
228
-
229
-
230
-
231
-
232
-
233
-
234
-
235
-
236
-
237
-
238
-
239
-
240
-
241
-
242
-
243
-
244
-
245
-
246
-
247
-
248
-
249
-
250
-
251
-
252
-
253
-
254
-
255
-
256
-
257
-
258
-
259
-
260
-
261
-
262
-
263
-
264
-
265
-
266
-
267
-
268
-
269
-
270
-
271
-
272
-
273
-
274
-
275
-
276
-
277
-
278
-
279
-
280
-
281
-
282
-
283
-
284
-
285
-
286
-
287
-
288
-
289
-
290
-
291
-
292
-
293
-
294
-
295
-
296
-
297
-
298
-
299
-
300
-
301
-
302
-
303
-
304
-
305
-
306
-
307
-
308
-
309
-
310
 |
 |

Barclays PLC
Annual Report 2006 11
Operating review
1
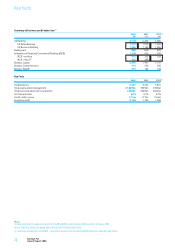
Consolidated profit and loss account summary – UK GAAP
For the year ended 31st December
2003 2002
£m £m
Interest receivable 12,427 12,044
Interest payable (5,823) (5,839)
Net interest income 6,604 6,205
Fees and commissions receivable 4,896 4,454
Less: fees and commissions payable (633) (529)
Dealing profits 1,054 833
Other operating income 490 364
Operating income 12,411 11,327
Administration expenses – staff costs (4,295) (3,755)
Administration expenses – other (2,404) (2,312)
Depreciation (289) (303)
Goodwill amortisation (265) (254)
Operating expenses (7,253) (6,624)
Operating profit before provisions 5,158 4,703
Provisions for bad and doubtful debts (1,347) (1,484)
Provisions for contingent liabilities and commitments 1 (1)
Provisions (1,346) (1,485)
Operating profit 3,812 3,218
Profit/(loss) from joint ventures 1 (5)
Profit/(loss) from associates 28 (5)
Exceptional items 4 (3)
Profit on ordinary activities before tax 3,845 3,205
Tax on profit on ordinary activities (1,076) (955)
Profit on ordinary activities after tax 2,769 2,250
Minority interests (including non-equity interests) (25) (20)
Profit for the financial year attributable to the members of Barclays PLC 2,744 2,230
Dividends (1,340) (1,206)
Profit retained for the financial year 1,404 1,024
Selected financial statistics
Basic earnings per share 42.3p 33.7p
Diluted earnings per share 42.1p 33.4p
Dividends per ordinary share 20.50p 18.35p
Dividend payout ratio 48.5% 54.5%
Attributable profit as a percentage of:
average shareholders’ funds 17.0% 14.7%
average total assets 0.6% 0.5%
Average United States Dollar exchange rate used in preparing the accounts 1.64 1.50
Average Euro exchange rate used in preparing the accounts 1.45 1.59
The financial information shown here is extracted from the published UK GAAP accounts for the years 2002 and 2003.