Bank of Montreal 1998 Annual Report Download - page 2
Download and view the complete annual report
Please find page 2 of the 1998 Bank of Montreal annual report below. You can navigate through the pages in the report by either clicking on the pages listed below, or by using the keyword search tool below to find specific information within the annual report.-
 1
1 -
 2
2 -
 3
3 -
 4
4 -
 5
5 -
 6
6 -
 7
7 -
 8
8 -
 9
9 -
 10
10 -
 11
11 -
 12
12 -
 13
13 -
14
-
15
-
16
-
17
-
18
-
19
-
20
-
21
-
22
-
23
-
24
-
25
-
26
-
27
-
28
-
29
-
30
-
31
-
32
-
33
-
34
-
35
-
36
-
37
-
38
-
39
-
40
-
41
-
42
-
43
-
44
-
45
-
46
-
47
-
48
-
49
-
50
-
51
-
52
-
53
-
54
-
55
-
56
-
57
-
58
-
59
-
60
-
61
-
62
-
63
-
64
-
65
-
66
-
67
-
68
-
69
-
70
-
71
-
72
-
73
-
74
-
75
-
76
-
77
-
78
-
79
-
80
-
81
-
82
-
83
-
84
-
85
-
86
-
87
-
88
-
89
-
90
-
91
-
92
-
93
-
94
-
95
-
96
-
97
-
98
-
99
-
100
-
101
-
102
-
103
-
104
-
105
-
106
 |
 |

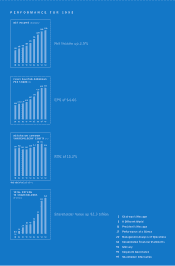
Net Income up 3.5%
989796959493929190
NET INCOME ($ millions)
1,305
1,168
986
825
709
640
595
522
1,350
989796959493929190
FULLY DILUTED EARNINGS
PER SHARE ($)
4.62
4.13
3.38
2.97
2.55
2.36
2.31
2.10
4.66
989796959493929190
RETURN ON COMMON
SHAREHOLDERS’ EQUITY (%)
17.1
17.0
15.4
14.9
14.1
14.1
15.0
14.6 15.2
989796959493929190
TOTAL RETURN
TO SHAREHOLDERS
($ billions)
1.2
(0.4)
2.8
4.0 4.2
5.8
8.8
14.6
15.9
ROE OBJECTIVE (15–17%)
ROE at 15.2%
Shareholder Value up $1.3 billion
EPS of $4.66
2 Chairman’s Message
5 A Different World
13 President’s Message
17 Performance at a Glance
20 Management Analysis of Operations
68 Consolidated Financial Statements
92 Glossary
93 Corporate Governance
97 Shareholder Information
PERFORMANCE FOR 1998