Bank of Montreal 1997 Annual Report Download - page 3
Download and view the complete annual report
Please find page 3 of the 1997 Bank of Montreal annual report below. You can navigate through the pages in the report by either clicking on the pages listed below, or by using the keyword search tool below to find specific information within the annual report.-
 1
1 -
 2
2 -
 3
3 -
 4
4 -
 5
5 -
 6
6 -
 7
7 -
 8
8 -
 9
9 -
 10
10 -
 11
11 -
 12
12 -
 13
13 -
 14
14 -
15
-
16
-
17
-
18
-
19
-
20
-
21
-
22
-
23
-
24
-
25
-
26
-
27
-
28
-
29
-
30
-
31
-
32
-
33
-
34
-
35
-
36
-
37
-
38
-
39
-
40
-
41
-
42
-
43
-
44
-
45
-
46
-
47
-
48
-
49
-
50
-
51
-
52
-
53
-
54
-
55
-
56
-
57
-
58
-
59
-
60
-
61
-
62
-
63
-
64
-
65
-
66
-
67
-
68
-
69
-
70
-
71
-
72
-
73
-
74
-
75
-
76
-
77
-
78
-
79
-
80
-
81
-
82
-
83
-
84
-
85
-
86
-
87
-
88
-
89
-
90
-
91
-
92
-
93
-
94
-
95
-
96
-
97
-
98
-
99
-
100
-
101
-
102
-
103
-
104
 |
 |

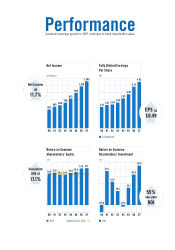
Performance
Sustained earnings growth in 1997 continues to build shareholder value.
ROI
9796959493929190
(%)
As Reported
9796959493929190
($)
Return on Common
Shareholders’ Investment
9796959493929190
($ millions)
Net Income Fully Diluted Earnings
Per Share
ROE Objective (14–15%)
9796959493929190
(%)
Return on Common
Shareholders’ Equity
55.0
42.4
24.1
(2.3)
32.4
(14.4)
47.4
4.62
2.97
2.55
2.36
2.31
2.10
4.13
3.38
14.9
14.1
14.6 15.0 14.1
17.1
17.0
15.4
1,305
1,168
986
825
709
640
595
522
19.4
Net Income
up
11.7%
Consistent
ROE at
17.1%
55%
one-year
ROI
EPS up
$0.49