Avnet 2002 Annual Report Download - page 3
Download and view the complete annual report
Please find page 3 of the 2002 Avnet annual report below. You can navigate through the pages in the report by either clicking on the pages listed below, or by using the keyword search tool below to find specific information within the annual report.-
 1
1 -
 2
2 -
 3
3 -
 4
4 -
 5
5 -
 6
6 -
 7
7 -
 8
8 -
 9
9 -
 10
10 -
 11
11 -
 12
12 -
 13
13 -
 14
14 -
15
-
16
-
17
-
18
-
19
-
20
-
21
-
22
-
23
-
24
-
25
-
26
-
27
-
28
-
29
-
30
-
31
-
32
-
33
-
34
-
35
-
36
-
37
-
38
-
39
-
40
-
41
-
42
-
43
-
44
-
45
-
46
-
47
-
48
-
49
-
50
-
51
-
52
-
53
-
54
-
55
-
56
-
57
-
58
-
59
-
60
-
61
-
62
-
63
-
64
-
65
-
66
-
67
-
68
-
69
-
70
-
71
-
72
-
73
-
74
-
75
-
76
-
77
-
78
-
79
-
80
-
81
-
82
-
83
-
84
-
85
-
86
-
87
-
88
-
89
-
90
-
91
 |
 |

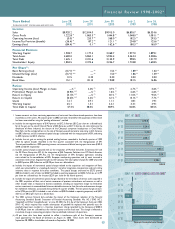
Financial Review 1998-2002*
*Income amounts are from continuing operations and net assets from discontinued operations have been
classified as current assets. All amounts prior to 2002 have been restated for the acquisition of Kent, which
has been accounted for using the “pooling-of-interests” method.
(A) Includes the net negative impact of $14.9 pre-tax and $12.5 after-tax ($0.12 per share on a diluted basis)
for (i) the gain on the sale of Channel Master of $33.8 pre-tax and $17.2 after-tax, (ii) costs relating to the
divestiture of Avnet Industrial, the closure of the Company’s corporate headquarters in Great Neck,
New York, and the anticipated loss on the sale of Company-owned real estate, amounting to $13.3 pre-tax
and $8.5 after-tax, and (iii) incremental special charges associated with the reorganization of EM, amounting
to $35.4 pre-tax and $21.2 after-tax.
(B) Includes the net gain on exiting the printed catalog business recorded in the fourth quarter of 1999
offset by special charges recorded in the first quarter associated with the reorganization of EM.
The net positive effect on 1999 operating income, net income and diluted earnings per share were $183.0,
$64.0 and $0.64, respectively.
(C) Includes special charges associated with: (i) the integration of Marshall Industries, Eurotronics B.V. and
the SEI Macro Group into EM, (ii) the integration of JBA Computer Solutions into CM North America,
(iii) the reorganization of EM Asia, (iv) the reorganization of EM’s European operations including
costs related to the consolidation of EM’s European warehousing operations and (v) costs incurred in
connection with certain litigation brought by the Company.The total special charges for 2000 amounted
to $49.0 pre-tax, $30.4 after-tax and $0.28 per share on a diluted basis.
(D) Includes the impact of incremental special charges related to the acquisition and integration of Kent,
which was accounted for as a “pooling-of-interests,” and other integration, reorganization and cost cutting
initiatives taken in response to business conditions. The special charges amounted to $327.5 pre-tax
($80.6 included in cost of sales and $246.9 included in operating expenses) and $236.7 after-tax, or $1.99
per share on a diluted basis for the year ($2.01 per share for the fourth quarter).
(E) Includes the impact of incremental special charges related to the write-down of certain assets acquired in
the 2001 acquisition of Kent, net of certain recoveries of previous write-downs and reserves, as well as
other charges taken in response to business conditions, including an impairment charge to write-down
certain investments in unconsolidated Internet-related businesses to their fair value and severance charges
for workforce reductions announced during the fourth quarter of 2002. The net special charges amount-
ed to $79.6 pre-tax ($21.6 included in cost of sales and $58.0 included in operating expenses) and $62.1
after-tax, or $0.52 per share on a diluted basis.
(F) The 2002 summary financial data excludes the impact of the Company’s adoption of the Financial
Accounting Standards Board’s Statement of Financial Accounting Standards No. 142 (“SFAS 142”),
“Goodwill and Other Intangible Assets,” on June 30, 2001, the first day of the Company’s fiscal year 2002.
SFAS 142, which requires that ratable amortization of goodwill be replaced with periodic tests for
goodwill impairment, resulted in a transition impairment charge recorded by the Company of $580.5,
or $4.90 per share on a diluted basis for the first quarter and the fiscal year. This charge is reflected as
cumulative change in accounting principle in the consolidated statements of operations.
(G) All per share data have been restated to reflect a two-for-one split of the Company’s common
stock approved by the Board of Directors on August 31, 2000. These shares were distributed on
September 28, 2000 to shareholders of record on September 18, 2000.
June 28, June 29, June 30, July 2, June 26,
2002 2001 2000 1999 1998
Income:
Sales $8,920.2 $12,814.0 $9,915.0 $6,805.7 $6,334.6
Gross Profit 1,222.8 (E) 1,865.5 (D) 1,444.8 (C) 1,048.0 (B) 1,081.1 (A)
Operating Income (loss) (3.0) (E) 253.7 (D) 368.0 (C) 182.5 (B) 293.5 (A)
Income Tax Provision (benefit) (36.4) (E) 87.2 (D) 121.1 (C) 204.8 (B) 125.6 (A)
Earnings (loss) (84.4) (E)(F) 0.1 (D) 162.6 (C) 180.3 (B) 165.9 (A)
Financial Position:
Working Capital 1,928.7 1,177.4 2,368.7 1,977.0 1,899.1
Total Assets 4,682.0 5,864.1 5,934.4 3,563.4 3,308.6
Total Debt 1,625.1 2,221.6 2,153.9 998.5 1,017.9
Shareholders’ Equity 1,804.5 2,374.6 2,246.7 1,718.8 1,628.5
Per Share(G):
Basic Earnings (loss) (0.71) (E)(F) — (D) 1.52 (C) 1.89 (B) 1.63 (A)
Diluted Earnings (loss) (0.71) (E)(F) — (D) 1.50 (C) 1.86 (B) 1.59 (A)
Dividends 0.15 0.30 0.30 0.30 0.30
Book Value 15.11 20.15 19.88 18.15 16.86
Ratios:
Operating Income (loss) Margin on Sales —% (E) 2.0% (D) 3.7% (C) 2.7% (B) 4.6% (A)
Profit (loss) Margin on Sales (0.9)% (E)(F) —% (D) 1.6% (C) 2.6% (B) 2.6% (A)
Return on Equity (4.1)% (E)(F) —% (D) 8.1% (C) 11.0% (B) 9.5% (A)
Return on Capital (0.2)% (E)(F) 2.2% (D) 6.1% (C) 8.1% (B) 7.7% (A)
Quick 1.2:1 0.7:1 1.1:1 1.8:1 1.9:1
Working Capital 2.5:1 1.5:1 2.2:1 3.3:1 3.9:1
Total Debt to Capital 47.4 % 48.3% 48.9% 36.8% 38.5%
IN MILLIONS,EXCEPT FOR PER SHARE AND RATIO DATA
Years Ended
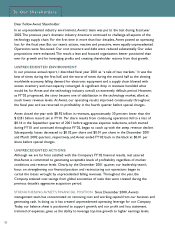
$ 2,144.8
$2,214.4
$2,359.8
$2,201.2
$2,537.7
$3,457.2
$3,630.5
$3,188.6
AVNET, INC. SALES
IN MILLIONS
Q4'02
Q3 '02
Q2 '02
Q1 '02
Q4 '01
Q3 '01
Q2 '01
Q1 '01
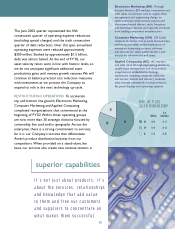
$.68
$.69
$.56
$.05
-$.16
-$.02
-$.01
$.01
AVNET, INC. DILUTED EARNINGS (LOSS) PER SHARE*
*Before special items described in notes (D through F)
Q4 '02
Q3 '02
Q2 '02
Q1 '02
Q4 '01
Q3 '01
Q2 '01
Q1 '01
1