Aviva 2013 Annual Report Download - page 14
Download and view the complete annual report
Please find page 14 of the 2013 Aviva annual report below. You can navigate through the pages in the report by either clicking on the pages listed below, or by using the keyword search tool below to find specific information within the annual report.-
 1
1 -
2
-
3
-
 4
4 -
 5
5 -
 6
6 -
 7
7 -
 8
8 -
 9
9 -
 10
10 -
 11
11 -
 12
12 -
 13
13 -
 14
14 -
 15
15 -
 16
16 -
 17
17 -
 18
18 -
 19
19 -
 20
20 -
 21
21 -
 22
22 -
 23
23 -
 24
24 -
25
-
26
-
27
-
28
-
29
-
30
-
31
-
32
-
33
-
34
-
35
-
36
-
37
-
38
-
39
-
40
-
41
-
42
-
43
-
44
-
45
-
46
-
47
-
48
-
49
-
50
-
51
-
52
-
53
-
54
-
55
-
56
-
57
-
58
-
59
-
60
-
61
-
62
-
63
-
64
-
65
-
66
-
67
-
68
-
69
-
70
-
71
-
72
-
73
-
74
-
75
-
76
-
77
-
78
-
79
-
80
-
81
-
82
-
83
-
84
-
85
-
86
-
87
-
88
-
89
-
90
-
91
-
92
-
93
-
94
-
95
-
96
-
97
-
98
-
99
-
100
-
101
-
102
-
103
-
104
-
105
-
106
-
107
-
108
-
109
-
110
-
111
-
112
-
113
-
114
-
115
-
116
-
117
-
118
-
119
-
120
-
121
-
122
-
123
-
124
-
125
-
126
-
127
-
128
-
129
-
130
-
131
-
132
-
133
-
134
-
135
-
136
-
137
-
138
-
139
-
140
-
141
-
142
-
143
-
144
-
145
-
146
-
147
-
148
-
149
-
150
-
151
-
152
-
153
-
154
-
155
-
156
-
157
-
158
-
159
-
160
-
161
-
162
-
163
-
164
-
165
-
166
-
167
-
168
-
169
-
170
-
171
-
172
-
173
-
174
-
175
-
176
-
177
-
178
-
179
-
180
-
181
-
182
-
183
-
184
-
185
-
186
-
187
-
188
-
189
-
190
-
191
-
192
-
193
-
194
-
195
-
196
-
197
-
198
-
199
-
200
-
201
-
202
-
203
-
204
-
205
-
206
-
207
-
208
-
209
-
210
-
211
-
212
-
213
-
214
-
215
-
216
-
217
-
218
-
219
-
220
-
221
-
222
-
223
-
224
-
225
-
226
-
227
-
228
-
229
-
230
-
231
-
232
-
233
-
234
-
235
-
236
-
237
-
238
-
239
-
240
-
241
-
242
-
243
-
244
-
245
-
246
-
247
-
248
-
249
-
250
-
251
-
252
-
253
-
254
-
255
-
256
-
257
-
258
-
259
-
260
-
261
-
262
-
263
-
264
-
265
-
266
-
267
-
268
-
269
-
270
-
271
-
272
-
273
-
274
-
275
-
276
-
277
-
278
-
279
-
280
-
281
-
282
-
283
-
284
-
285
-
286
-
287
-
288
-
289
-
290
-
291
-
292
-
293
-
294
-
295
-
296
-
297
-
298
-
299
-
300
-
301
-
302
-
303
-
304
-
305
-
306
-
307
-
308
-
309
-
310
-
311
-
312
-
313
-
314
-
315
-
316
-
317
-
318
-
319
-
320
 |
 |

Aviva plc
Annual report and accounts 2013
12
Chief Financial Ofcer’s statement continued
The above costs are included in other operations
and the impact of this cost is offset by a gain from
the curtailment of the Irish pension scheme.
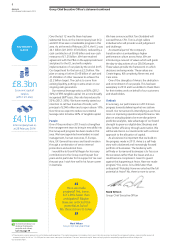
Capital and liquidity
Our 2013 economic capital surplus4 is £8.3 billion
with a coverage ratio of 182% (2012: pro forma
£7.1 billion5). This includes the impact of moving
the pension scheme calibration to a fully funded
basis, which reduced the surplus by
approximately £0.7 billion. We have increased the
economic capital surplus during the year by a
combination of product mix changes, capital
allocation, asset optimisation, hedging, expense
reductions and completion of disposals.
Economic capital is our preferred measure of
capitalisation, especially in anticipation of a
transition to Solvency II. Our IGD surplus has
reduced modestly to £3.6 billion (2012: £3.8
billion), with positive capital generation more
than offset by the reduction in value of in-force as
a result of the legislation changes to Polish
pensions.
Economic capital surplus1
(£bn)
2011 Pro forma
2012
2013
£3.6bn
(130%)
£7.1bn2
(172%)
£8.3bn
(182%)
In 2013 we were included on the list of nine
Global Systemically Important Insurers and will
work closely with the regulators to understand
the implications of this.
Cash remittances have increased by 40% from
2012 to £1,269 million with a remittance ratio of
72% of OCG up from 49% in 2012 with both
business units in the UK reporting large increases.
In UK Life this was due to improved pricing,
capital allocation and cost reductions, while in
UK GI the improvement was primarily due to the
restructure of the intercompany loan. It was also
encouraging to see dividends resume from Italy
and Ireland and increased dividends from France
and Poland.
Cash remittances
Total by country*
Operational
capital
generation
£m
Dividend
£m
Remitted
to Group
Change
from
2012 vs
2013
UK & Ireland Life 595 370 62% 147%
UK & Ireland GI** 374 347 93% 131%
France 294 235 80% 16%
Canada 177 130 73% (4)%
Poland 135 85 63% 21%
Spain 51 51 100% (25)%
Turkey (10) 5–67%
Asia 97 20 21% (20)%
Italy 88 12 14% n/a
Other*** (29) 14 n/a n/a
Total 1,772 1,269 72% 40%
* Continuing operations
** Includes £347 million remitted in January 2014
*** Other includes Aviva Investors and Other Group activities.
The £1.3 billion of remittances are used to
fund the dividend, internal and external interest
payments along with central costs resulting in
a neutral centre operating cash ow in 2013,
improving from a decit in 2012.
Group centre liquidity currently stands at
£1.6 billion following the receipts from the
disposals of Aviva USA, Delta Lloyd and Aseval
amongst others.
Intercompany loan
As part of the structural reorganisation of the
Group we moved a number of businesses from
the UK GI legal entity (AIL6) to be owned by Aviva
Group Holdings (AGH). These businesses were
paid for by way of an intercompany loan by AIL
to AGH of £5.8 billion.
Key statistics
in 2013
£3.6bn
IGD surplus
£1.8bn
Operating capital
generation
17.8%
Return on equity
Cash remittances
have increased by 40%
from 2012 with a
remittance ratio
of 72% of OCG.
Patrick Regan
Chief Financial Ofcer
4 The economic capital surplus represents an estimated unaudited position. The term ‘economic capital’ relates to Aviva’s own internal assessment and capital management policies and does not imply
capital as required by regulators or other third parties.
5 The pro forma economic capital surplus at 31 December 2012 included the benet of disposals and an increase in pension scheme risk allowance from ve to ten years of stressed contributions.
6 Aviva Insurance Limited.