Atmos Energy 2014 Annual Report Download - page 20
Download and view the complete annual report
Please find page 20 of the 2014 Atmos Energy annual report below. You can navigate through the pages in the report by either clicking on the pages listed below, or by using the keyword search tool below to find specific information within the annual report.-
 1
1 -
2
-
3
-
4
-
5
-
6
-
7
-
8
-
9
-
 10
10 -
 11
11 -
 12
12 -
 13
13 -
 14
14 -
 15
15 -
 16
16 -
 17
17 -
 18
18 -
 19
19 -
 20
20 -
 21
21 -
 22
22 -
 23
23 -
 24
24 -
 25
25 -
 26
26 -
 27
27 -
 28
28 -
 29
29 -
 30
30 -
31
-
32
-
33
-
34
-
35
-
36
 |
 |

Earnings Growth Through Infrastructure Investments and Rate Mechanisms
18
REGULATORY OUTCOMES
Our growth strategy is designed to increase the value of our
regulated rate base between 9 percent and 10 percent on a com-
pounded annual basis through scal 2018. e timely recovery of
our infrastructure investments and regulated expenses through
constructive regulatory mechanisms is the key driver of our nan-
cial results.
During scal 2014, we implemented new rates from 18 lings.
When combined with regulatory deferrals, these rate outcomes
should result in operating income increases of approximately
$134.0 million.
About $115.2 million of these operating income increases
resulted from lings in Texas, where almost 70 percent of our
regulated assets are located.
We forecast adding during the next four scal years between
$100 million and $135 million annually in operating income
increases from rate adjustments.
WEATHER EFFECTS
Weather, which was 20 percent colder than normal in scal
2014, boosted the earnings of our regulated distribution seg-
ment, regulated pipeline segment and nonregulated segment. Six
of the eight states we serve recorded the coldest heating season in
the past 15 years.
EXCEPTIONAL RESULTS
In scal 2014, we achieved exceptional results that demonstrate
the benets of our realigned growth strategy.
Consolidated net income increased 19 percent from $243.2
million in scal 2013 to $289.8 million in scal 2014. Earnings
per diluted share went up 32 cents, from $2.64 in scal 2013 to
$2.96 in scal 2014. e year-over-year increase marked our 12th
consecutive year of growth in earnings per share.
Dividends paid per share were $1.48, an increase of 8 cents, or
5.7 percent, over the previous year’s dividend. Our payout ratio
of between 50 percent and 55 percent remains below that of most
utilities, allowing for continued annual increases in our dividend.
Total shareholder return in scal 2014 was 15.5 percent. Our
three-year total return to shareholders since implementing our
new strategy in scal 2012 was 63.8 percent. at compares with
an average shareholder return among 11 “peer” companies during
the same three-year period of 56.4 percent.
As a sign of condence in the direction the company is headed,
our board of directors in November 2014 increased the annual
dividend again by 8 cents a share. e indicated dividend for scal
2015 is $1.56 a share. is marked our 31st consecutive annual
dividend increase.
More than 75 percent of our capital expenditures in scal 2014
were dedicated to safety and reliability. Atmos Energy’s total regu-
lated rate base grew by $578.0 million to approximately $4.9 billion.
CONSTRUCTIVE REGULATORY MECHANISMS SUPPORT EFFICIENT CONVERSION
OF OUR RATE-BASE GROWTH OPPORTUNITIES INTO OUR FINANCIAL RESULTS
$900 MILLION TO $1.1 BILLION
IN ANNUAL CAPITAL INVESTMENTS
THROUGH FISCAL 2018
CONSTRUCTIVE RATE MECHANISMS
REDUCING REGULATORY LAG
6% TO 8% CONSOLIDATED
EARNINGS-PER-SHARE GROWTH
$8.0
$6.0
$4.0
$2.0
$0.0
2012 2018E
REGULATED PIPELINE
REGULATED DISTRIBUTION
WITHIN 0–6 MONTHS
WITHIN 7–12 MONTHS
GREATER THAN 12 MONTHS
EARNING ON INVESTMENT:
9% –10% COMPOUNDED
AVERAGE GROWTH RATE
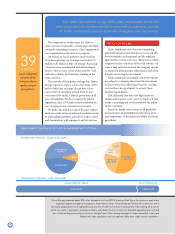
FISCAL 2015 ESTIMATED CAPITAL RECOVERY 6%–8% INCREASE ANNUALLY
91%
5%
2012 2013 2014 2015E 2018E
$4.00
$3.00
$2.00
$1.00
$0.00
RATE BASE IN BILLIONS OF DOLLARS