Assurant 2014 Annual Report Download - page 9
Download and view the complete annual report
Please find page 9 of the 2014 Assurant annual report below. You can navigate through the pages in the report by either clicking on the pages listed below, or by using the keyword search tool below to find specific information within the annual report.-
 1
1 -
 2
2 -
 3
3 -
 4
4 -
 5
5 -
 6
6 -
 7
7 -
 8
8 -
 9
9 -
 10
10 -
 11
11 -
 12
12 -
 13
13 -
 14
14 -
 15
15 -
 16
16 -
 17
17 -
 18
18 -
 19
19 -
 20
20 -
21
-
22
-
23
-
24
-
25
-
26
-
27
-
28
-
29
-
30
-
31
-
32
-
33
-
34
-
35
-
36
-
37
-
38
-
39
-
40
-
41
-
42
-
43
-
44
-
45
-
46
-
47
-
48
-
49
-
50
-
51
-
52
-
53
-
54
-
55
-
56
-
57
-
58
-
59
-
60
-
61
-
62
-
63
-
64
-
65
-
66
-
67
-
68
-
69
-
70
-
71
-
72
-
73
-
74
-
75
-
76
-
77
-
78
-
79
-
80
-
81
-
82
-
83
-
84
-
85
-
86
-
87
-
88
-
89
-
90
-
91
-
92
-
93
-
94
-
95
-
96
-
97
-
98
-
99
-
100
-
101
-
102
-
103
-
104
-
105
-
106
-
107
-
108
-
109
-
110
-
111
-
112
-
113
-
114
-
115
-
116
-
117
-
118
-
119
-
120
-
121
-
122
-
123
-
124
-
125
-
126
-
127
-
128
-
129
-
130
-
131
-
132
-
133
-
134
-
135
-
136
-
137
-
138
-
139
-
140
-
141
-
142
-
143
-
144
-
145
-
146
-
147
-
148
-
149
-
150
-
151
-
152
-
153
-
154
-
155
-
156
-
157
-
158
-
159
-
160
-
161
 |
 |

7 ▪ 2014 ASSURANT ANNUAL REPORT
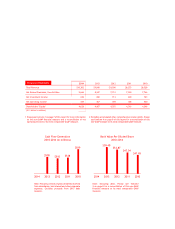
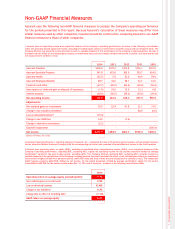
Non-GAAP Financial Measures
Assurant uses the following non-GAAP fi nancial measures to analyze the Company’s operating performance
for the periods presented in this report. Because Assurant’s calculation of these measures may differ from
similar measures used by other companies, investors should be careful when comparing Assurant’s non-GAAP
fi nancial measures to those of other companies.
1 Assurant uses net operating income as an important measure of the Company’s operating performance. As shown in the following reconciliation
table, net operating income equals net income, excluding net realized gains (losses) on investments and other unusual and/or infrequent items. The
Company believes net operating income provides investors a valuable measure of the performance of the Company’s ongoing business, because it
excludes both the effect of net realized gains (losses) on investments that tend to be highly variable from period to period, and those events that
are unusual and/or unlikely to recur.
(a) Assurant Specialty Property, a reporting segment of Assurant, Inc., completed the sale of its general agency business and associated insurance
carrier, American Reliable Insurance Company with the corresponding net loss on sale recorded in consolidated net income in the fourth quarter.
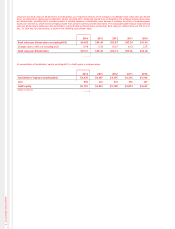
2 Assurant uses operating return on equity (ROE), excluding accumulated other comprehensive income (AOCI), as an important measure of the
Company’s operating performance. Operating ROE, excluding AOCI, equals net operating income for the periods presented divided by average
stockholders’ equity for the year-to-date period, excluding AOCI. The Company believes operating ROE, excluding AOCI, provides investors a
valuable measure of the performance of the Company’s ongoing business, because it excludes the effect of net realized gains (losses) on investments
that tend to be highly variable from period-to-period, other AOCI items and those events that are unusual and/or unlikely to recur. The comparable
GAAP measure would be GAAP ROE, defi ned as net income, for the period presented, divided by average stockholders’ equity for the period.
Consolidated GAAP ROE for the twelve months ended Dec. 31, 2014 was 9.4 percent, as shown in the following reconciliation table.
2014 2013 2012 2011 2010
Assurant Solutions $218.9 $125.2 $123.8 $136.1 $101.5
Assurant Specialty Property 341.8 423.6 305.0 303.7 424.5
Assurant Health (63.7) 5.9 52.0 40.9 54.9
Assurant Employee Benefi ts 48.7 34.6 58.1 43.1 63.6
Corporate and other (67.7) (82.9) (62.4) (60.0) (52.4)
Amortization of deferred gain on disposal of businesses (1.0) 10.6 12.0 13.3 6.8
Interest expense (38.0) (50.5) (39.2) (39.2) (39.4)
Net operating income 439.0 466.5 449.3 437.9 559.5
Adjustments:
Net realized gains on investments 39.5 22.4 41.8 21.1 31.5
Change in tax valuation allowance - - - 80.0 (6.0)
Loss on divested business(a) (19.4) ----
Change in tax liabilities 14.0 - (7.4) - -
Change in derivative investment (2.2) ----
Goodwill impairment - - - - (306.4)
Net income $470.9 $488.9 $483.7 $539.0 $278.6
(dollars in millions, net of tax)
2014
Operating return on average equity (excluding AOCI) 9.7%
Net realized gains on investments 0.9%
Loss on divested business (0.4)%
Change in tax liabilit ies 0.3%
Change due to effect of including AOCI (1.1)%
GAAP return on average equity 9.4 %