Assurant 2014 Annual Report Download - page 2
Download and view the complete annual report
Please find page 2 of the 2014 Assurant annual report below. You can navigate through the pages in the report by either clicking on the pages listed below, or by using the keyword search tool below to find specific information within the annual report.-
 1
1 -
 2
2 -
 3
3 -
 4
4 -
 5
5 -
 6
6 -
 7
7 -
 8
8 -
 9
9 -
 10
10 -
 11
11 -
 12
12 -
 13
13 -
14
-
15
-
16
-
17
-
18
-
19
-
20
-
21
-
22
-
23
-
24
-
25
-
26
-
27
-
28
-
29
-
30
-
31
-
32
-
33
-
34
-
35
-
36
-
37
-
38
-
39
-
40
-
41
-
42
-
43
-
44
-
45
-
46
-
47
-
48
-
49
-
50
-
51
-
52
-
53
-
54
-
55
-
56
-
57
-
58
-
59
-
60
-
61
-
62
-
63
-
64
-
65
-
66
-
67
-
68
-
69
-
70
-
71
-
72
-
73
-
74
-
75
-
76
-
77
-
78
-
79
-
80
-
81
-
82
-
83
-
84
-
85
-
86
-
87
-
88
-
89
-
90
-
91
-
92
-
93
-
94
-
95
-
96
-
97
-
98
-
99
-
100
-
101
-
102
-
103
-
104
-
105
-
106
-
107
-
108
-
109
-
110
-
111
-
112
-
113
-
114
-
115
-
116
-
117
-
118
-
119
-
120
-
121
-
122
-
123
-
124
-
125
-
126
-
127
-
128
-
129
-
130
-
131
-
132
-
133
-
134
-
135
-
136
-
137
-
138
-
139
-
140
-
141
-
142
-
143
-
144
-
145
-
146
-
147
-
148
-
149
-
150
-
151
-
152
-
153
-
154
-
155
-
156
-
157
-
158
-
159
-
160
-
161
 |
 |

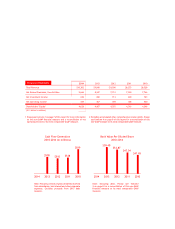
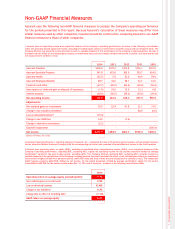
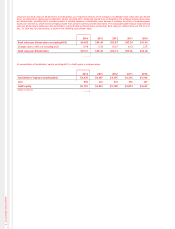
Financial Highlights
2014
2013 2012 2011 2010
Total Revenue $10,382
$9,048 $ 8,508 $8,273 $8,528
Net Earned Premiums, Fees & Other
9,666 8,347 7,712
7,530
7,766
Net Investment Income
656 650
713 690
703
Net Operating Income1
439
467 449 438
560
Shareholders’ Equity2
4,626 4,407 4,355 4,316 4,346
(U.S. dollars in millions)
1 Please see footnote 1 on page 7 of this report for more information
on this non-GAAP fi nancial measure and a reconciliation of net
operating income to its most comparable GAAP measure.
2 Excluding accumulated other comprehensive income (AOCI). Please
see footnote 4 on page 8 of this report for a reconciliation of this
non-GAAP measure to its most comparable GAAP measure.
2011201220132014 2010
$819
Cash Flow Generation
2010–2014 (in millions)
$538
$510
$558
$607
2011201220132014 2010
$41.65
Book Value Per Diluted Share
2010–2014
$47.34
$53.87
$59.48
$64.82
Note: Excluding AOCI. Please see footnote
3 on page 8 for a reconciliation of this non-GAAP
fi nancial measure to its most comparable GAAP
measure.
Note: Primarily consists of gross dividends received
from subsidiaries, less interest and other corporate
expenses. Excludes proceeds from 2013 debt
issuance.