Anthem Blue Cross 2008 Annual Report Download - page 16
Download and view the complete annual report
Please find page 16 of the 2008 Anthem Blue Cross annual report below. You can navigate through the pages in the report by either clicking on the pages listed below, or by using the keyword search tool below to find specific information within the annual report.-
 1
1 -
2
-
3
-
4
-
5
-
 6
6 -
 7
7 -
 8
8 -
 9
9 -
 10
10 -
 11
11 -
 12
12 -
 13
13 -
 14
14 -
 15
15 -
 16
16 -
 17
17 -
 18
18 -
 19
19
 |
 |

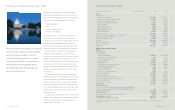
WELLPOINT, INC. 2928 WELLPOINT, INC.
CONSOLIDATED STATEMENTS OF CASH FLOW
In millions Years ended December 31 08 07 06
Operating activities
Net income $«2,490.7 $«3,345.4 $«3,094.9
Adjustments to reconcile net income to net cash
provided by operating activities
Net realized losses (gains) on investments 1,179.2 (11.2) 0.3
Loss on disposal of assets 7.2 11.3 1.7
Deferred income taxes (481.4) (105.5) 273.7
Amortization, net of accretion 466.3 466.0 471.9
Depreciation expense 105.4 120.2 133.0
Impairment of intangible assets 141.4 ––
Share-based compensation 156.0 177.1 246.9
Excess tax benefits from share-based compensation (16.0) (153.3) (136.5)
Changes in operating assets and liabilities, net of
effect of business combinations
Receivables, net (558.7) (448.6) (627.8)
Other invested assets, current 103.3 (3.0) 234.9
Other assets (340.2) 174.4 (362.4)
Policy liabilities 194.9 257.7 852.6
Unearned income (26.7) 125.5 (69.5)
Accounts payable and accrued expenses (106.3) (235.2) (91.7)
Other liabilities (797.0) 176.5 134.2
Income taxes (47.3) 447.3 (112.0)
Other, net 64.6 ––
Net cash provided by operating activities 2,535.4 4,344.6 4,044.2
Investing activities
Net proceeds from (purchases of) fixed maturity securities 1,173.3 (184.6) (801.7)
Net (purchases of) proceeds from equity securities (244.4) 22.5 516.4
Net purchases of other invested assets (112.2) (92.0) (419.6)
Changes in securities lending collateral 325.1 50.6 485.2
Net purchases of subsidiaries, net of cash acquired (192.7) (298.5) (25.4)
Net purchases of property and equipment (332.9) (264.7) (187.5)
Other, net –(2.2) (24.7)
Net cash provided by (used in) investing activities 616.2 (768.9) (457.3)
Financing activities
Net (repayments of) proceeds from commercial paper borrowings (900.6) 502.8 (306.0)
Proceeds from long-term borrowings 525.0 1,978.3 2,668.2
Net proceeds from short-term borrowings 98.0 ––
Repayment of long-term borrowings (38.7) (509.7) (2,162.1)
Changes in securities lending payable (325.1) (50.6) (485.2)
Changes in bank overdrafts 44.8 (117.1) 414.3
Repurchase and retirement of common stock (3,276.2) (6,151.4) (4,550.2)
Proceeds from exercise of employee stock options and
employee stock purchase plan 121.2 784.5 559.5
Excess tax benefits from share-based compensation 16.0 153.3 136.5
Net cash used in financing activities (3,735.6) (3,409.9) (3,725.0)
Change in cash and cash equivalents (584.0) 165.8 (138.1)
Cash and cash equivalents at beginning of year 2,767.9 2,602.1 2,740.2
Cash and cash equivalents at end of year $«2,183.9 $«2,767.9 $«2,602.1
The information presented above should be read in conjunction with the audited financial statements and accompanying notes included in WellPoint’s 2008
Annual Report on Form 10-K.
CONSOLIDATED STATEMENTS OF INCOME
In millions, except per share data Years ended December 31 08 07 06
Revenues
Premiums $57,101.0 $55,865.0 $51,971.9
Administrative fees 3,836.6 3,673.6 3,594.8
Other revenue 641.6 617.0 613.1
Total operating revenue 61,579.2 60,155.6 56,179.8
Net investment income 851.1 1,001.1 878.7
Net realized (losses) gains on investments (1,179.2) 11.2 (0.3)
Total revenues 61,251.1 61,167.9 57,058.2
Expenses
Benefit expense 47,742.4 46,037.2 42,192.0
Selling, general and administrative expense
Selling expense 1,778.4 1,716.8 1,654.5
General and administrative expense 7,242.1 6,984.7 7,163.2
Total selling, general and administrative expense 9,020.5 8,701.5 8,817.7
Cost of drugs 468.5 432.7 433.2
Interest expense 469.8 447.9 403.5
Amortization of other intangible assets 286.1 290.7 297.4
Impairment of intangible assets 141.4 ––
Total expenses 58,128.7 55,910.0 52,143.8
Income before income tax expense 3,122.4 5,257.9 4,914.4
Income tax expense 631.7 1,912.5 1,819.5
Net income $÷2,490.7 $÷3,345.4 $÷3,094.9
Net income per share
Basic $÷÷÷«4.79 $÷÷÷«5.64 $÷÷÷«4.93
Diluted $÷÷÷«4.76 $÷÷÷«5.56 $÷÷÷«4.82
The information presented above should be read in conjunction with the audited financial statements and accompanying notes included in WellPoint’s 2008
Annual Report on Form 10-K.