Amazon.com 2004 Annual Report Download - page 5
Download and view the complete annual report
Please find page 5 of the 2004 Amazon.com annual report below. You can navigate through the pages in the report by either clicking on the pages listed below, or by using the keyword search tool below to find specific information within the annual report.-
 1
1 -
 2
2 -
 3
3 -
 4
4 -
 5
5 -
 6
6 -
 7
7 -
 8
8 -
 9
9 -
 10
10 -
 11
11 -
 12
12 -
 13
13 -
 14
14 -
 15
15 -
 16
16 -
17
-
18
-
19
-
20
-
21
-
22
-
23
-
24
-
25
-
26
-
27
-
28
-
29
-
30
-
31
-
32
-
33
-
34
-
35
-
36
-
37
-
38
-
39
-
40
-
41
-
42
-
43
-
44
-
45
-
46
-
47
-
48
-
49
-
50
-
51
-
52
-
53
-
54
-
55
-
56
-
57
-
58
-
59
-
60
-
61
-
62
-
63
-
64
-
65
-
66
-
67
-
68
-
69
-
70
-
71
-
72
-
73
-
74
-
75
-
76
-
77
-
78
-
79
-
80
-
81
-
82
-
83
-
84
-
85
-
86
-
87
-
88
-
89
-
90
-
91
-
92
-
93
-
94
-
95
-
96
-
97
-
98
-
99
-
100
-
101
-
102
-
103
-
104
 |
 |

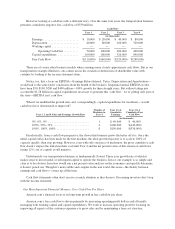
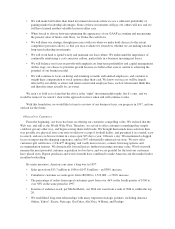
We have a cash generative operating cycle1because we turn our inventory quickly, collecting payments
from our customers before payments are due to suppliers. Our high inventory turnover means we maintain
relatively low levels of investment in inventory—$480 million at year end on a sales base of nearly $7 billion.
The capital efficiency of our business model is illustrated by our modest investments in fixed assets, which
were $246 million at year end or 4% of 2004 sales.
Free cash flow2grew 38% to $477 million in 2004, a $131 million improvement over the prior year. We are
confident that if we continue to improve customer experience—including increasing selection and lowering
prices—and execute efficiently, our value proposition, as well as our free cash flow, will further expand.
As to dilution, total shares outstanding plus stock-based awards are essentially unchanged at the end of 2004
compared with 2003, and are down 1% over the last three years. During that same period, we’ve also eliminated
over six million shares of potential future dilution by repaying more than $600 million of convertible debt that
was due in 2009 and 2010. Efficiently managing share count means more cash flow per share and more long-
term value for owners.
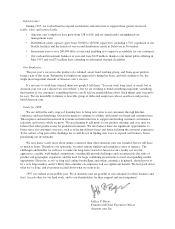
This focus on free cash flow isn’t new for Amazon.com. We made it clear in our 1997 letter to
shareholders—our first as a public company—that when “forced to choose between optimizing GAAP
accounting and maximizing the present value of future cash flows, we’ll take the cash flows.” I’m attaching a
copy of our complete 1997 letter and encourage current and prospective shareowners to take a look at it.
As always, we at Amazon.com are grateful to our customers for their business and trust, to each other for
our hard work, and to our shareholders for their support and encouragement.
Jeffrey P. Bezos
Founder and Chief Executive Officer
Amazon.com, Inc.
April 2005
1The operating cycle is number of days of sales in inventory plus number of days of sales in accounts
receivable minus accounts payable days.
2Free cash flow is defined as net cash provided by operating activities less purchases of fixed assets,
including capitalized internal-use software and website development, both of which are presented on our
statements of cash flows. Free cash flow for 2004 of $477 million is net cash provided by operating
activities of $567 million less purchases of fixed assets, including capitalized internal-use software and
website development costs, of $89 million. Free cash flow for 2003 of $346 million is net cash provided by
operating activities of $392 million less purchases of fixed assets, including capitalized internal-use
software and website development costs, of $46 million.