Amazon.com 2004 Annual Report Download - page 3
Download and view the complete annual report
Please find page 3 of the 2004 Amazon.com annual report below. You can navigate through the pages in the report by either clicking on the pages listed below, or by using the keyword search tool below to find specific information within the annual report.-
 1
1 -
 2
2 -
 3
3 -
 4
4 -
 5
5 -
 6
6 -
 7
7 -
 8
8 -
 9
9 -
 10
10 -
 11
11 -
 12
12 -
 13
13 -
 14
14 -
15
-
16
-
17
-
18
-
19
-
20
-
21
-
22
-
23
-
24
-
25
-
26
-
27
-
28
-
29
-
30
-
31
-
32
-
33
-
34
-
35
-
36
-
37
-
38
-
39
-
40
-
41
-
42
-
43
-
44
-
45
-
46
-
47
-
48
-
49
-
50
-
51
-
52
-
53
-
54
-
55
-
56
-
57
-
58
-
59
-
60
-
61
-
62
-
63
-
64
-
65
-
66
-
67
-
68
-
69
-
70
-
71
-
72
-
73
-
74
-
75
-
76
-
77
-
78
-
79
-
80
-
81
-
82
-
83
-
84
-
85
-
86
-
87
-
88
-
89
-
90
-
91
-
92
-
93
-
94
-
95
-
96
-
97
-
98
-
99
-
100
-
101
-
102
-
103
-
104
 |
 |

To our shareholders:
Our ultimate financial measure, and the one we most want to drive over the long-term, is free cash flow per
share.
Why not focus first and foremost, as many do, on earnings, earnings per share or earnings growth? The
simple answer is that earnings don’t directly translate into cash flows, and shares are worth only the present value
of their future cash flows, not the present value of their future earnings. Future earnings are a component—but
not the only important component—of future cash flow per share. Working capital and capital expenditures are
also important, as is future share dilution.
Though some may find it counterintuitive, a company can actually impair shareholder value in certain
circumstances by growing earnings. This happens when the capital investments required for growth exceed the
present value of the cash flow derived from those investments.
To illustrate with a hypothetical and very simplified example, imagine that an entrepreneur invents a
machine that can quickly transport people from one location to another. The machine is expensive—$160 million
with an annual capacity of 100,000 passenger trips and a four year useful life. Each trip sells for $1,000 and
requires $450 in cost of goods for energy and materials and $50 in labor and other costs.
Continue to imagine that business is booming, with 100,000 trips in Year 1, completely and perfectly
utilizing the capacity of one machine. This leads to earnings of $10 million after deducting operating expenses
including depreciation—a 10% net margin. The company’s primary focus is on earnings; so based on initial
results the entrepreneur decides to invest more capital to fuel sales and earnings growth, adding additional
machines in Years 2 through 4.
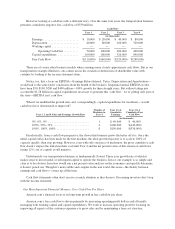
Here are the income statements for the first four years of business:
Earnings
Year 1 Year 2 Year 3 Year 4
(in thousands)
Sales ............................ $100,000 $200,000 $400,000 $800,000
Units sold ..................... 100 200 400 800
Growth ....................... N/A 100% 100% 100%
Gross profit ....................... 55,000 110,000 220,000 440,000
Gross margin .................. 55% 55% 55% 55%
Depreciation ...................... 40,000 80,000 160,000 320,000
Labor & other costs ................. 5,000 10,000 20,000 40,000
Earnings .......................... $ 10,000 $ 20,000 $ 40,000 $ 80,000
Margin ....................... 10% 10% 10% 10%
Growth ....................... N/A 100% 100% 100%
It’s impressive: 100% compound earnings growth and $150 million of cumulative earnings. Investors
considering only the above income statement would be delighted.