Amazon.com 2004 Annual Report Download - page 4
Download and view the complete annual report
Please find page 4 of the 2004 Amazon.com annual report below. You can navigate through the pages in the report by either clicking on the pages listed below, or by using the keyword search tool below to find specific information within the annual report.-
 1
1 -
 2
2 -
 3
3 -
 4
4 -
 5
5 -
 6
6 -
 7
7 -
 8
8 -
 9
9 -
 10
10 -
 11
11 -
 12
12 -
 13
13 -
 14
14 -
 15
15 -
16
-
17
-
18
-
19
-
20
-
21
-
22
-
23
-
24
-
25
-
26
-
27
-
28
-
29
-
30
-
31
-
32
-
33
-
34
-
35
-
36
-
37
-
38
-
39
-
40
-
41
-
42
-
43
-
44
-
45
-
46
-
47
-
48
-
49
-
50
-
51
-
52
-
53
-
54
-
55
-
56
-
57
-
58
-
59
-
60
-
61
-
62
-
63
-
64
-
65
-
66
-
67
-
68
-
69
-
70
-
71
-
72
-
73
-
74
-
75
-
76
-
77
-
78
-
79
-
80
-
81
-
82
-
83
-
84
-
85
-
86
-
87
-
88
-
89
-
90
-
91
-
92
-
93
-
94
-
95
-
96
-
97
-
98
-
99
-
100
-
101
-
102
-
103
-
104
 |
 |

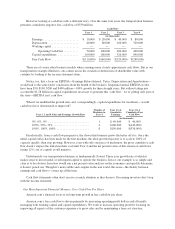
However, looking at cash flows tells a different story. Over the same four years, the transportation business
generates cumulative negative free cash flow of $530 million.
Cash Flows
Year 1 Year 2 Year 3 Year 4
(in thousands)
Earnings ........................ $ 10,000 $ 20,000 $ 40,000 $ 80,000
Depreciation .................... 40,000 80,000 160,000 320,000
Working capital .................. — — — —
Operating Cash Flow .......... 50,000 100,000 200,000 400,000
Capital expenditures .............. 160,000 160,000 320,000 640,000
Free Cash Flow .................. $(110,000) $ (60,000) $(120,000) $(240,000)
There are of course other business models where earnings more closely approximate cash flows. But as our
transportation example illustrates, one cannot assess the creation or destruction of shareholder value with
certainty by looking at the income statement alone.
Notice, too, that a focus on EBITDA—Earnings Before Interest, Taxes, Depreciation and Amortization—
would lead to the same faulty conclusion about the health of the business. Sequential annual EBITDA would
have been $50, $100, $200 and $400 million—100% growth for three straight years. But without taking into
account the $1.28 billion in capital expenditures necessary to generate this ‘cash flow,’ we’re getting only part of
the story—EBITDA isn’t cash flow.
What if we modified the growth rates and, correspondingly, capital expenditures for machinery—would
cash flows have deteriorated or improved?
Year 2, 3 and 4 Sales and Earnings Growth Rate
Number of
Machines in
Year 4
Year 1 to 4
Cumulative
Earnings
Year 1 to 4
Cumulative Free
Cash Flow
(in thousands)
0%,0%,0% ............................ 1 $ 40,000 $ 40,000
100%, 50%, 33% ........................ 4 $100,000 $(140,000)
100%, 100%, 100% ...................... 8 $150,000 $(530,000)
Paradoxically, from a cash flow perspective, the slower this business grows the better off it is. Once the
initial capital outlay has been made for the first machine, the ideal growth trajectory is to scale to 100% of
capacity quickly, then stop growing. However, even with only one piece of machinery, the gross cumulative cash
flow doesn’t surpass the initial machine cost until Year 4 and the net present value of this stream of cash flows
(using 12% cost of capital) is still negative.
Unfortunately our transportation business is fundamentally flawed. There is no growth rate at which it
makes sense to invest initial or subsequent capital to operate the business. In fact, our example is so simple and
clear as to be obvious. Investors would run a net present value analysis on the economics and quickly determine
it doesn’t pencil out. Though it’s more subtle and complex in the real world, this issue—the duality between
earnings and cash flows—comes up all the time.
Cash flow statements often don’t receive as much attention as they deserve. Discerning investors don’t stop
with the income statement.
Our Most Important Financial Measure: Free Cash Flow Per Share
Amazon.com’s financial focus is on long-term growth in free cash flow per share.
Amazon.com’s free cash flow is driven primarily by increasing operating profit dollars and efficiently
managing both working capital and capital expenditures. We work to increase operating profit by focusing on
improving all aspects of the customer experience to grow sales and by maintaining a lean cost structure.