Allegheny Power 2010 Annual Report Download - page 19
Download and view the complete annual report
Please find page 19 of the 2010 Allegheny Power annual report below. You can navigate through the pages in the report by either clicking on the pages listed below, or by using the keyword search tool below to find specific information within the annual report.
4
contained in any forward-looking statements. The registrants expressly disclaim any current intention to update any forward-
looking statements contained herein as a result of new information, future events or otherwise.
EXECUTIVE SUMMARY
Earnings available to FirstEnergy Corp. in 2010 were $784 million, or basic earnings of $2.58 per share of common stock
($2.57 diluted), compared with $1.01 billion, or basic earnings of $3.31 per share of common stock ($3.29 diluted), in 2009
and $1.34 billion, or basic earnings of $4.41 per share ($4.38 diluted), in 2008.
Change in Basic Earnings Per Share From Prior Year 2010 2009
Basic Earnings Per Share – Prior Year $ 3.31 $ 4.41
Non-core asset sales/impairments (0.37) 0.47
Generating plant impairments (0.77) -
Litigation settlement 0.04 (0.03)
Trust securities impairments 0.03 0.16
Regulatory charges 0.45 (0.55)
Derivative mark-to-market adjustment 0.35 (0.42)
Organizational restructuring 0.14 (0.14)
Debt redemption premium 0.32 (0.31)
Merger transaction costs - 2010 (0.16) -
Income tax resolution (0.57) 0.68
Revenues 1.06 (1.85)
Fuel and purchased power (0.68) (0.09)
A
mortization of regulatory assets, net 0.22 (0.02)
Investment income (0.20) 0.20
Interest expense - (0.14)
Transmission expense (0.20) 0.73
Other expenses (0.39) 0.21
Basic Earnings Per Share $ 2.58 $ 3.31
2010 was a transformational year for FirstEnergy, and one in which we built a strong foundation for future success.
On February 11, 2010, FirstEnergy and Allegheny announced a proposed merger that would create the nation’s largest
electric utility system, with:
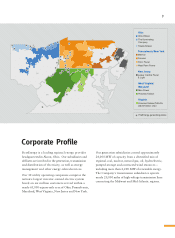
more than 6 million customers across ten regulated electric distribution subsidiaries in Ohio, Pennsylvania, New
Jersey, Maryland and West Virginia,
generation subsidiaries owning or controlling approximately 24,000 MWs of generating capacity from a diversified
mix of coal, nuclear, natural gas, oil and renewable power, and
transmission subsidiaries owning over 20,000 miles of high-voltage lines connecting the Midwest and Mid-Atlantic.
Pursuant to the terms of the merger, Allegheny shareholders would receive 0.667 of a share of FirstEnergy common stock in
exchange for each share of Allegheny they own.
2010 also marked FirstEnergy’s final transition year to competitive markets with the expiration of the rate cap on Met-Ed and
Penelec’s retail generation rates on December 31, 2010. Beginning in 2011, Met-Ed and Penelec obtain their power supply
from the competitive wholesale market and fully recover their generation costs through retail rates. All of FirstEnergy’s other
regulated utilities previously transitioned to competitive generation markets.
The effects of the uncertainty in the U.S. economy continue to present challenges. Although economic recovery began
across our service territories, power sales and deliveries have still not returned to pre-recessionary levels. Distribution
deliveries in 2010 were 108.0 million MWH, compared with 102.3 million MWH in 2009, driven primarily by an 8.4% increase
in deliveries to the industrial sector, with the largest gains from customers in the automotive and steel industries. Industrial
usage is lagging pre-recessionary levels by approximately 11%. Residential sales were up 6%, primarily due to warmer
weather during the summer of 2010. Wholesale power prices continued to be weak however; generation output improved in
2010 with output of 74.9 million MWH compared to the 2009 output of 65.6 million MWH.
In the second half of 2010, FES entered into financial transactions that offset the mark-to-market impact of 500 MW of legacy
purchased power contracts which were entered into in 2008 for delivery in 2010 and 2011 and which were marked to market
beginning in December 2009. These financial transactions eliminate the volatility in GAAP earnings associated with marking
these contracts to market through the end of 2011.
•
•
•


