Alcoa 2010 Annual Report Download - page 4
Download and view the complete annual report
Please find page 4 of the 2010 Alcoa annual report below. You can navigate through the pages in the report by either clicking on the pages listed below, or by using the keyword search tool below to find specific information within the annual report.-
 1
1 -
 2
2 -
 3
3 -
 4
4 -
 5
5 -
 6
6 -
 7
7 -
 8
8 -
 9
9 -
 10
10 -
 11
11 -
 12
12 -
 13
13 -
 14
14 -
 15
15 -
16
-
17
-
18
-
19
-
20
-
21
-
22
-
23
-
24
-
25
-
26
-
27
-
28
-
29
-
30
-
31
-
32
-
33
-
34
-
35
-
36
-
37
-
38
-
39
-
40
-
41
-
42
-
43
-
44
-
45
-
46
-
47
-
48
-
49
-
50
-
51
-
52
-
53
-
54
-
55
-
56
-
57
-
58
-
59
-
60
-
61
-
62
-
63
-
64
-
65
-
66
-
67
-
68
-
69
-
70
-
71
-
72
-
73
-
74
-
75
-
76
-
77
-
78
-
79
-
80
-
81
-
82
-
83
-
84
-
85
-
86
-
87
-
88
-
89
-
90
-
91
-
92
-
93
-
94
-
95
-
96
-
97
-
98
-
99
-
100
-
101
-
102
-
103
-
104
-
105
-
106
-
107
-
108
-
109
-
110
-
111
-
112
-
113
-
114
-
115
-
116
-
117
-
118
-
119
-
120
-
121
-
122
-
123
-
124
-
125
-
126
-
127
-
128
-
129
-
130
-
131
-
132
-
133
-
134
-
135
-
136
-
137
-
138
-
139
-
140
-
141
-
142
-
143
-
144
-
145
-
146
-
147
-
148
-
149
-
150
-
151
-
152
-
153
-
154
-
155
-
156
-
157
-
158
-
159
-
160
-
161
-
162
-
163
-
164
-
165
-
166
-
167
-
168
-
169
-
170
-
171
-
172
-
173
-
174
-
175
-
176
-
177
-
178
-
179
-
180
-
181
-
182
-
183
-
184
-
185
-
186
 |
 |

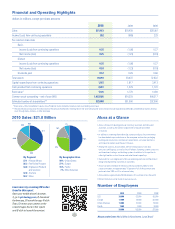
By the end of 2010, Alcoa’s fi nancial results showed the success of our Cash Sustainability Program:
• Achieved cash from operations of $2.3 billion in 2010 compared to $1.4 billion in 2009, we drove free cash fl ow from $(257) million in 2009
to $1.2 billion in 2010. This is our best result since 2003.
• Net income improved from $(1.15 billion) in 2009 to $254 million in 2010.
• With adjusted EBITDA of $2.7 billion, a 653% improvement from 2009, our adjusted EBITDA margin was 12.9%, 11 points better than 2009.
• We strengthened the balance sheet by reducing our debt by $654 million, and extended our debt maturity.
• Our debt to capital ratio dropped to 34.9% – 380 basis points lower than 2009 and back in our target range.
• Thanks to our fi nancial and operational initiatives, Alcoa maintained investment grade status through the downturn.
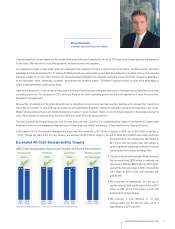
We know that savings like these must be sustainable over the long-term. Certainly, there will be challenges along the way, from currency exchange
rates to the high cost of energy in some regions – both issues that we continue to manage. Yet, with the systemic changes we have put in place, we
are well-positioned in 2011 to maximize profi table growth and shareholder value as our end markets begin to mend and aluminum demand increases
across most regions.
Because of Alcoa’s strong global presence, particularly in growth regions, we have an unparalleled opportunity to leverage our improved cost base and
to create solutions for our customers that no other competitor can match. Our goal is for Alcoa to capture valuable market share while maintaining
profi table growth.
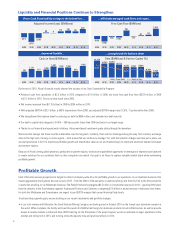
Profi table Growth
Each of Alcoa’s business groups has set targets to refl ect a Company-wide drive for profi table growth in our operations. In our Upstream business, this
means aggressively driving down the cost curve by 2015 – from the 30th to 23rd percentile in alumina refi ning, and from the 51st to the 41st percentile
in aluminum smelting. In our Midstream business, Flat-Rolled Products has targeted $2.5 billion in incremental revenue by 2013 – growing 50% faster
than the industry. In the Downstream segment, Engineered Products and Solutions is targeting $1.6 billion in added revenue in that same time frame.
For both the Midstream and Downstream, we expect to see EBITDA margins that exceed historical high levels.
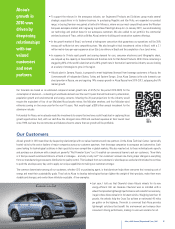
To achieve these growth goals, we are building on our recent investments and portfolio changes:
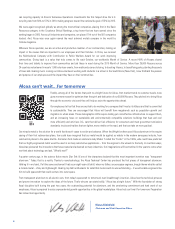
• In our joint venture with Ma’aden, the Saudi Arabian Mining Company, we broke ground in October 2010 on the lowest-cost aluminum complex in
the world. When complete, the facility will meet the needs of a Middle East hungry for aluminum products to build infrastructure, as well as provide
access to nearby markets in India and Asia. With fi nancing for the fi rst phase of the project signed, we are on schedule to begin operations at the
smelter and rolling mill in 2013, and to bring online the bauxite mine and alumina refi nery in 2014.
2
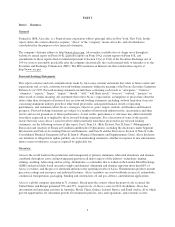
Drove Cash Sustainability savings to the bottom line…
Adjusted Income (Loss) ($ Millions)
(409)
(742)
(90) (186)
761
(22)
87 176
1,005
762
1,131 851 1,066
1,481 1,292 1,344
843
1,543
4Q ’08 1Q ’09 2Q ’09 3Q ’09 4Q ’09 1Q ’10 2Q ’10 3Q ’10 4Q ’10
4Q ’08 1Q ’09 2Q ’09 3Q ’09 4Q ’09 1Q ’10 2Q ’10 3Q ’10 4Q ’10
4Q ’08 1Q ’09 2Q ’09 3Q ’09 4Q ’09 1Q ’10 2Q ’10 3Q ’10 4Q ’10
4Q ’08 1Q ’09 2Q ’09 3Q ’09 4Q ’09 1Q ’10 2Q ’10 3Q ’10 4Q ’10
Cash on Hand ($ Millions)
Free Cash Flow ($ Millions)
Debt ($ Millions) & Debt-to-Capital (%)
…improved liquidity…
…efficiently managed cash flows and capex…
…strengthened the balance sheet
(221)
(477)
(256)
39 9101 139 96
223
10,578
10,205 10,265
Gross Debt Debt-to-Cap
42.5%
38.7%
10,073 9,819 9,757 9,800
9,309 9,165
34.9%
Liquidity and Financial Positions Continue to Strengthen