Alcoa 2010 Annual Report Download - page 17
Download and view the complete annual report
Please find page 17 of the 2010 Alcoa annual report below. You can navigate through the pages in the report by either clicking on the pages listed below, or by using the keyword search tool below to find specific information within the annual report.-
 1
1 -
 2
2 -
 3
3 -
 4
4 -
 5
5 -
 6
6 -
 7
7 -
 8
8 -
 9
9 -
 10
10 -
 11
11 -
 12
12 -
 13
13 -
 14
14 -
 15
15 -
 16
16 -
 17
17 -
 18
18 -
 19
19 -
 20
20 -
 21
21 -
 22
22 -
 23
23 -
 24
24 -
 25
25 -
 26
26 -
 27
27 -
 28
28 -
 29
29 -
 30
30 -
 31
31 -
 32
32 -
 33
33 -
 34
34 -
 35
35 -
 36
36 -
 37
37 -
 38
38 -
 39
39 -
 40
40 -
 41
41 -
 42
42 -
 43
43 -
 44
44 -
 45
45 -
 46
46 -
 47
47 -
 48
48 -
 49
49 -
 50
50 -
 51
51 -
 52
52 -
 53
53 -
 54
54 -
 55
55 -
 56
56 -
 57
57 -
 58
58 -
 59
59 -
 60
60 -
 61
61 -
 62
62 -
 63
63 -
 64
64 -
 65
65 -
 66
66 -
 67
67 -
 68
68 -
 69
69 -
 70
70 -
 71
71 -
 72
72 -
 73
73 -
 74
74 -
 75
75 -
 76
76 -
 77
77 -
 78
78 -
 79
79 -
 80
80 -
 81
81 -
 82
82 -
 83
83 -
 84
84 -
 85
85 -
 86
86 -
 87
87 -
 88
88 -
 89
89 -
 90
90 -
 91
91 -
 92
92 -
 93
93 -
 94
94 -
 95
95 -
 96
96 -
 97
97 -
 98
98 -
 99
99 -
 100
100 -
 101
101 -
 102
102 -
 103
103 -
 104
104 -
 105
105 -
 106
106 -
 107
107 -
 108
108 -
 109
109 -
 110
110 -
 111
111 -
 112
112 -
 113
113 -
 114
114 -
 115
115 -
 116
116 -
 117
117 -
 118
118 -
 119
119 -
 120
120 -
 121
121 -
 122
122 -
 123
123 -
 124
124 -
 125
125 -
 126
126 -
 127
127 -
 128
128 -
 129
129 -
 130
130 -
 131
131 -
 132
132 -
 133
133 -
 134
134 -
 135
135 -
 136
136 -
 137
137 -
 138
138 -
 139
139 -
 140
140 -
 141
141 -
 142
142 -
 143
143 -
 144
144 -
 145
145 -
 146
146 -
 147
147 -
 148
148 -
 149
149 -
 150
150 -
 151
151 -
 152
152 -
 153
153 -
 154
154 -
 155
155 -
 156
156 -
 157
157 -
 158
158 -
 159
159 -
 160
160 -
 161
161 -
 162
162 -
 163
163 -
 164
164 -
 165
165 -
 166
166 -
 167
167 -
 168
168 -
 169
169 -
 170
170 -
 171
171 -
 172
172 -
 173
173 -
 174
174 -
 175
175 -
 176
176 -
 177
177 -
 178
178 -
 179
179 -
 180
180 -
 181
181 -
 182
182 -
 183
183 -
 184
184 -
 185
185 -
 186
186
 |
 |

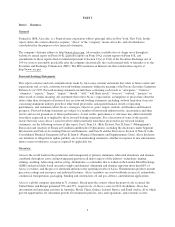
Primary Aluminum Facilities and Capacity
The company’s primary aluminum smelters and their respective capacities are shown in the following table:
Alcoa Worldwide Smelting Capacity
Country Facility
Owners
(% Of Ownership)
Nameplate
Capacity1
(000 MTPY)
Alcoa
Consolidated
Capacity2
(000 MTPY)
Australia Point Henry AofA (100%) 190 1903
Portland AofA (55%)
CITIC4(22.5%)
Marubeni4(22.5%) 35851973
Brazil Poços de Caldas Alumínio (100%) 96696
São Luís (Alumar) Alumínio (60%)
BHP Billiton4(40%) 447 268
Canada Baie Comeau, Que. Alcoa (100%) 3857385
Bécancour, Que. Alcoa (74.95%)
Rio Tinto Alcan Inc.8(25.05%) 413 310
Deschambault, Que. Alcoa (100%) 260 260
Iceland Fjarðaál Alcoa (100%) 344 344
Italy Fusina Alcoa (100%) 44944
Portovesme Alcoa (100%) 1509150
Norway Lista Alcoa (100%)10 94 94
Mosjøen Alcoa (100%)10 188 188
Spain Avilés Alcoa (100%) 9311 93
La Coruña Alcoa (100%) 87 87
San Ciprián Alcoa (100%) 228 228
United States Evansville, IN (Warrick) Alcoa (100%) 26912 269
Frederick, MD
(Eastalco) Alcoa (100%) 013 0
Badin, NC Alcoa (100%) 014 0
Massena East, NY Alcoa (100%) 12515 125
Massena West, NY Alcoa (100%) 130 130
Mount Holly, SC Alcoa (50.33%)
Century Aluminum Company4
(49.67%) 229 115
Alcoa, TN Alcoa (100%) 21516 215
Rockdale, TX Alcoa (100%) 26717 267
Ferndale, WA (Intalco) Alcoa (100%) 27918 279
Wenatchee, WA Alcoa (100%) 18419 184
TOTAL 5,075 4,518
1Nameplate Capacity is an estimate based on design capacity and normal operating efficiencies and does not necessarily
represent maximum possible production.
2The figures in this column reflect Alcoa’s share of production from these facilities.
9
