Air Canada 2012 Annual Report Download - page 2
Download and view the complete annual report
Please find page 2 of the 2012 Air Canada annual report below. You can navigate through the pages in the report by either clicking on the pages listed below, or by using the keyword search tool below to find specific information within the annual report.-
 1
1 -
 2
2 -
 3
3 -
 4
4 -
 5
5 -
 6
6 -
 7
7 -
 8
8 -
 9
9 -
 10
10 -
 11
11 -
 12
12 -
 13
13 -
14
-
15
-
16
-
17
-
18
-
19
-
20
-
21
-
22
-
23
-
24
-
25
-
26
-
27
-
28
-
29
-
30
-
31
-
32
-
33
-
34
-
35
-
36
-
37
-
38
-
39
-
40
-
41
-
42
-
43
-
44
-
45
-
46
-
47
-
48
-
49
-
50
-
51
-
52
-
53
-
54
-
55
-
56
-
57
-
58
-
59
-
60
-
61
-
62
-
63
-
64
-
65
-
66
-
67
-
68
-
69
-
70
-
71
-
72
-
73
-
74
-
75
-
76
-
77
-
78
-
79
-
80
-
81
-
82
-
83
-
84
-
85
-
86
-
87
-
88
-
89
-
90
-
91
-
92
-
93
-
94
-
95
-
96
-
97
-
98
-
99
-
100
-
101
-
102
-
103
-
104
-
105
-
106
-
107
-
108
-
109
-
110
-
111
-
112
-
113
-
114
-
115
-
116
-
117
-
118
-
119
-
120
-
121
-
122
-
123
-
124
-
125
-
126
-
127
-
128
-
129
-
130
-
131
-
132
-
133
-
134
-
135
-
136
-
137
-
138
-
139
-
140
-
141
-
142
-
143
-
144
-
145
-
146
-
147
-
148
-
149
-
150
 |
 |

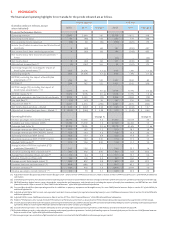
1. HIGHLIGHTS
The fi nancial and operating highlights for Air Canada for the periods indicated are as follows.
(Canadian dollars in millions, except
where indicated)
Fourth Quarter Full Year
2012 2011 Change $ 2012 2011 Change $
Financial Performance Metrics
Operating revenues 2,841 2,699 142 12,120 11,612 508
Operating income (loss) 46 (98) 144 437 179 258
Non-operating income (expense) (38) 38 (76) (250) (429) 179
Income (loss) before income taxes and discontinued
operations 8 (60) 68 187 (250) 437
Net income (loss) from continuing operations 8 (60) 68 186 (249) 435
Net income (loss) from discontinued operations –
Aveos – – – (55) – (55)
Net income (loss) 8 (60) 68 131 (249) 380
Adjusted net income (loss) (1) (6) (167) 161 53 (122) 175
Operating margin (%), excluding the impact of
benefi t plan amendments (2) 1.6% (3.6)% 5.2 pp 2.6% 1.5% 1.1 pp
Operating margin % 1.6% (3.6)% 5.2 pp 3.6% 1.5% 2.1 pp
EBITDAR, excluding the impact of benefi t plan
amendments (2) (3) 284 162 122 1,327 1,242 85
EBITDAR (3) 284 162 122 1,451 1,242 209
EBITDAR margin (%), excluding the impact of
benefi t plan amendments (2) (3) 10.0% 6.0% 4.0 pp 10.9% 10.7% 0.2 pp
EBITDAR margin % (3) 10.0% 6.0% 4.0 pp 12.0% 10.7% 1.3 pp
Cash, cash equivalents and short-term investments 2,026 2,099 (73) 2,026 2,099 (73)
Free cash fl ow (4) (23) (62) 39 187 356 (169)
Adjusted net debt (5) 4,281 4,576 (295) 4,281 4,576 (295)
Net income (loss) per share – diluted $ 0.03 $ (0.22) $ 0.25 $ 0.45 $ (0.92) $ 1.37
Adjusted net income (loss) per share – diluted (1) $ (0.02) $ (0.60) $ 0.58 $ 0.19 $ (0.44) $ 0.63
Operating Statistics Change % Change %
Revenue passenger miles (millions) (RPM) 12,574 12,065 4.2 55,646 54,223 2.6
Available seat miles (millions) (ASM) 15,484 15,290 1.3 67,269 66,460 1.2
Passenger load factor % 81.2% 78.9% 2.3 pp 82.7% 81.6% 1.1 pp
Passenger revenue per RPM (“Yield”) (cents) 19.7 19.5 1.2 19.0 18.7 1.8
Passenger revenue per ASM (“RASM”) (cents) 16.0 15.4 4.2 15.8 15.3 3.2
Operating revenue per ASM (cents) 18.4 17.7 3.9 18.0 17.5 3.1
Operating expense per ASM (“CASM”) (cents) 18.1 18.3 (1.3) 17.4 17.2 1.0
Adjusted CASM (cents) (6) 12.4 12.6 (2.0) 11.8 11.7 1.0
Average number of full-time equivalent (FTE)
employees (thousands) (7) 24.1 23.6 2.1 24.0 23.7 1.4
Aircraft in operating fl eet at period end (8) 351 352 (0.3) 351 352 (0.3)
Average fl eet utilization (hours per day) (9) 9.5 9.4 1.3 10.1 10.1 0.6
Revenue frequencies (thousands) 134 133 0.5 557 551 1.1
Average aircraft fl ight length (miles) (9) 863 857 0.8 891 892 (0.1)
Economic fuel cost per litre (cents) (10) 88.8 88.6 0.2 89.7 85.2 5.3
Fuel litres (millions) (9) 924 912 1.3 3,976 3,937 1.0
Revenue passengers carried (millions) (11) 8.3 7.9 5.1 34.9 33.9 2.9
(1) Adjusted net income (loss) and adjusted net income (loss) per share – diluted are non-GAAP fi nancial measures. Refer to section 20 “Non-GAAP Financial Measures” of the MD&A for additional
information.
(2) In the third quarter of 2012, Air Canada recorded an operating expense reduction of $124 million related to changes to the terms of the ACPA collective agreement pertaining to retirement age.
(3) EBITDAR (earnings before interest, taxes, depreciation, amortization and impairment, and aircraft rent), excluding the impact of benefi t plan amendments, and EBITDAR are non-GAAP
fi nancial measures. Refer to section 20 "Non-GAAP Financial Measures" of the MD&A for additional information.
(4) Free cash fl ow (cash fl ows from operating activities less additions to property, equipment and intangible assets) is a non-GAAP fi nancial measure. Refer to section 9.5 of the MD&A for
additional information.
(5) Adjusted net debt (total debt less cash, cash equivalents and short-term investments plus capitalized operating leases) is a non-GAAP fi nancial measure. Refer to section 9.3 of the MD&A for
additional information.
(6) Adjusted CASM is a non-GAAP fi nancial measure. Refer to section 20 “Non-GAAP Financial Measures” of the MD&A for additional information.
(7) Refl ects FTE employees at Air Canada. Excludes FTE employees at third party carriers (such as at Jazz Aviation LP (“Jazz”)) operating under capacity purchase agreements with Air Canada.
(8) Includes Jazz aircraft covered under the capacity purchase agreement between Jazz and Air Canada (“Jazz CPA”) and aircraft operated by third party carriers operating under capacity purchase
agreements. Refer to section 8 of the MD&A for additional information on Air Canada’s operating fl eet.
(9) Excludes charter operations. Also excludes third party carriers operating under capacity purchase agreements, other than Jazz aircraft covered under the Jazz CPA.
(10) Excludes third party carriers, other than Jazz, operating under capacity purchase agreements. Includes fuel handling expenses. Economic fuel price per litre is a non-GAAP fi nancial measure.
Refer to sections 6 and 7 of the MD&A for additional information.
(11) Revenue passengers are counted on a fl ight number basis which is consistent with the IATA defi nition of revenue passengers carried.