Aetna 2014 Annual Report Download - page 8
Download and view the complete annual report
Please find page 8 of the 2014 Aetna annual report below. You can navigate through the pages in the report by either clicking on the pages listed below, or by using the keyword search tool below to find specific information within the annual report.
Annual Report- Page 2
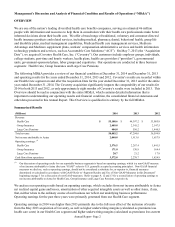
Management’s Discussion and Analysis of Financial Condition and Results of Operations (“MD&A”)
OVERVIEW
We are one of the nation’s leading diversified health care benefits companies, serving an estimated 46 million
people with information and resources to help them in consultation with their health care professionals make better
informed decisions about their health care. We offer a broad range of traditional, voluntary and consumer-directed
health insurance products and related services, including medical, pharmacy, dental, behavioral health, group life
and disability plans, medical management capabilities, Medicaid health care management services, Medicare
Advantage and Medicare supplement plans, workers’ compensation administrative services and health information
technology products and services, such as Accountable Care Solutions (“ACS”). On May 7, 2013 (the “Acquisition
Date”), we acquired Coventry Health Care, Inc. (“Coventry”). Our customers include employer groups, individuals,
college students, part-time and hourly workers, health plans, health care providers (“providers”), governmental
units, government-sponsored plans, labor groups and expatriates. Our operations are conducted in three business
segments: Health Care, Group Insurance and Large Case Pensions.
The following MD&A provides a review of our financial condition at December 31, 2014 and December 31, 2013
and operating results for the years ended December 31, 2014, 2013 and 2012. Coventry’s results are recorded within
our Health Care segment on and after the Acquisition Date for the year ended December 31, 2013 and for the entire
year ended December 31, 2014. The Coventry acquisition significantly impacts the comparability of our results for
2014 to both 2013 and 2012, as only approximately eight months of Coventry’s results were included in 2013. This
Overview should be read in conjunction with the entire MD&A, which contains detailed information that is
important to understanding our operating results and financial condition, the consolidated financial statements and
other data presented in this Annual Report. This Overview is qualified in its entirety by the full MD&A.
Summarized Results
(Millions) 2014 2013 2012
Revenue:
Health Care $ 55,108.6 $ 44,397.2 $ 33,005.8
Group Insurance 2,489.8 2,341.2 2,147.5
Large Case Pensions 404.8 556.2 1,446.5
Total revenue 58,003.2 47,294.6 36,599.8
Net income attributable to Aetna 2,040.8 1,913.6 1,657.9
Operating earnings: (1)
Health Care 2,376.5 2,267.4 1,841.5
Group Insurance 171.0 130.9 164.4
Large Case Pensions 20.7 21.2 17.8
Cash flows from operations 3,372.8 2,278.7 1,824.9
(1) Our discussion of operating results for our reportable business segments is based on operating earnings, which is a non-GAAP measure
of net income attributable to Aetna (the term “GAAP” refers to U.S. generally accepted accounting principles). Non-GAAP financial
measures we disclose, such as operating earnings, should not be considered a substitute for, or superior to, financial measures
determined or calculated in accordance with GAAP. Refer to “Segment Results and Use of Non-GAAP Measures in this Document”
beginning on page 5 for a discussion of non-GAAP measures. Refer to pages 8, 12 and 13 for a reconciliation of operating earnings to
net income attributable to Aetna for Health Care, Group Insurance and Large Case Pensions, respectively.
We analyze our operating results based on operating earnings, which excludes from net income attributable to Aetna
net realized capital gains and losses, amortization of other acquired intangible assets as well as other items, if any,
that, neither relate to the ordinary course of our business nor reflect our underlying business performance.
Operating earnings for the past three years were primarily generated from our Health Care segment.
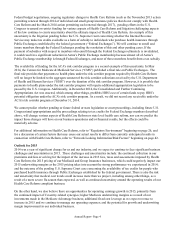
Operating earnings in 2014 were higher than 2013 primarily due to the full-year effect of the inclusion of results
from the May 2013 acquisition of Coventry, as well as higher underwriting margins (calculated as premiums less
health care costs) in our Health Care segment and higher underwriting margins (calculated as premiums less current


