Aetna 2014 Annual Report Download - page 18
Download and view the complete annual report
Please find page 18 of the 2014 Aetna annual report below. You can navigate through the pages in the report by either clicking on the pages listed below, or by using the keyword search tool below to find specific information within the annual report.-
 1
1 -
2
-
3
-
4
-
5
-
6
-
7
-
 8
8 -
 9
9 -
 10
10 -
 11
11 -
 12
12 -
 13
13 -
 14
14 -
 15
15 -
 16
16 -
 17
17 -
 18
18 -
 19
19 -
 20
20 -
 21
21 -
 22
22 -
 23
23 -
 24
24 -
 25
25 -
 26
26 -
 27
27 -
 28
28 -
29
-
30
-
31
-
32
-
33
-
34
-
35
-
36
-
37
-
38
-
39
-
40
-
41
-
42
-
43
-
44
-
45
-
46
-
47
-
48
-
49
-
50
-
51
-
52
-
53
-
54
-
55
-
56
-
57
-
58
-
59
-
60
-
61
-
62
-
63
-
64
-
65
-
66
-
67
-
68
-
69
-
70
-
71
-
72
-
73
-
74
-
75
-
76
-
77
-
78
-
79
-
80
-
81
-
82
-
83
-
84
-
85
-
86
-
87
-
88
-
89
-
90
-
91
-
92
-
93
-
94
-
95
-
96
-
97
-
98
-
99
-
100
-
101
-
102
-
103
-
104
-
105
-
106
-
107
-
108
-
109
-
110
-
111
-
112
-
113
-
114
-
115
-
116
-
117
-
118
-
119
-
120
-
121
-
122
-
123
-
124
-
125
-
126
-
127
-
128
-
129
-
130
-
131
-
132
-
133
-
134
-
135
-
136
-
137
-
138
-
139
-
140
-
141
-
142
-
143
-
144
-
145
-
146
-
147
-
148
-
149
-
150
-
151
-
152
-
153
-
154
-
155
-
156
 |
 |

Annual Report- Page 12
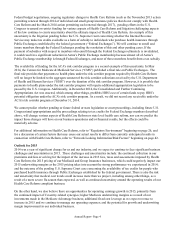
The table presented below reconciles net income attributable to Aetna to operating earnings (1):
(Millions) 2014 2013 2012
Net income attributable to Aetna $ 179.6 $ 125.2 $ 176.3
Net realized capital gains, net of tax (9.4) (.8) (14.8)
Amortization of other acquired intangible assets, net of tax .8 2.9 2.9
Charge for changes in life insurance claim payment practices, net of tax —35.7 —
Reversal of allowance and gain on sale of reinsurance recoverable, net of tax —(32.1) —
Operating earnings $ 171.0 $ 130.9 $ 164.4
(1) In addition to net realized capital gains and amortization of other acquired intangible assets, the following other items are excluded from
operating earnings because we believe they neither relate to the ordinary course of our business nor reflect our underlying business
performance:
• In the fourth quarter of 2013, we increased our estimated liability for unpaid life insurance claims with respect to insureds who
passed away on or before December 31, 2013, and recorded in current and future benefits a charge of $35.7 million ($55.0 million
pretax) as a result of changes during the fourth quarter of 2013 in our life insurance claim payment practices (including related
escheatment practices) based on evolving industry practices and regulatory expectations and interpretations. Refer to Note 18 of
Notes to Consolidated Financial Statements beginning on page 127 for additional information on the changes in our life insurance
claim payment practices.
• In 2008, as a result of the liquidation proceedings of Lehman Re Ltd. (“Lehman Re”), a subsidiary of Lehman Brothers Holdings
Inc., we recorded an allowance against our reinsurance recoverable from Lehman Re of $27.4 million ($42.2 million pretax). This
reinsurance was placed in 1999 and was on a closed book of paid-up group whole life insurance business. In 2013, we sold our
claim against Lehman Re to an unrelated third party (including the reinsurance recoverable) and terminated the reinsurance
arrangement. Upon the sale of the claim and termination of the arrangement, we reversed the related allowance thereby reducing
other general and administrative expenses by $27.4 million ($42.2 million pretax) and recognized a $4.7 million ($7.2 million
pretax) gain on the sale in fees and other revenue.
Operating earnings for 2014 increased by $40.1 million compared to 2013, primarily due to higher underwriting
margins, reflecting improved experience in both our life and disability products, partially offset by lower net
investment income due primarily to lower yields on debt securities. Operating earnings for 2013 declined by $33.5
million compared to 2012, primarily reflecting lower underwriting margins in our group life insurance products due
to higher claim incidence, partially offset by higher underwriting margins in our disability products.
Our group benefit ratios, which represent current and future benefits divided by premiums, were 85.2% for 2014,
93.5% for 2013, and 88.3% for 2012. The improvement in our group benefit ratio in 2014 is primarily due to higher
underwriting margins, reflecting improved experience in both our life and disability products. The increase in our
group benefit ratio in 2013 is primarily due to the fourth quarter 2013 charge related to changes in our life insurance
claim payment practices (including related escheatment practices) and lower underwriting margins in our group life
insurance products from higher claim incidence, partially offset by higher underwriting margins in our disability
products.
LARGE CASE PENSIONS
Large Case Pensions manages a variety of retirement products (including pension and annuity products) primarily
for tax-qualified pension plans. These products provide a variety of funding and benefit payment distribution
options and other services. The Large Case Pensions segment includes certain discontinued products.