Activision 2012 Annual Report Download - page 4
Download and view the complete annual report
Please find page 4 of the 2012 Activision annual report below. You can navigate through the pages in the report by either clicking on the pages listed below, or by using the keyword search tool below to find specific information within the annual report.-
 1
1 -
 2
2 -
 3
3 -
 4
4 -
 5
5 -
 6
6 -
 7
7 -
 8
8 -
 9
9 -
 10
10 -
 11
11 -
 12
12 -
 13
13 -
 14
14 -
 15
15 -
16
-
17
-
18
-
19
-
20
-
21
-
22
-
23
-
24
-
25
-
26
-
27
-
28
-
29
-
30
-
31
-
32
-
33
-
34
-
35
-
36
-
37
-
38
-
39
-
40
-
41
-
42
-
43
-
44
-
45
-
46
-
47
-
48
-
49
-
50
-
51
-
52
-
53
-
54
-
55
-
56
-
57
-
58
-
59
-
60
-
61
-
62
-
63
-
64
-
65
-
66
-
67
-
68
-
69
-
70
-
71
-
72
-
73
-
74
-
75
-
76
-
77
-
78
-
79
-
80
-
81
-
82
-
83
-
84
-
85
-
86
-
87
-
88
-
89
-
90
-
91
-
92
-
93
-
94
-
95
-
96
-
97
-
98
-
99
-
100
 |
 |

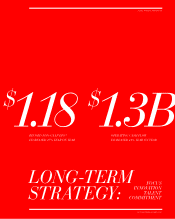
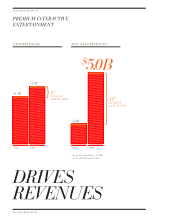
DRIVES
REVENUES
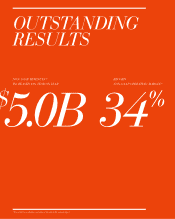
GAAP REVENUES
PREMIUM INTERACTIVE
ENTERTAINMENT
11%
INCREASE
YEAR ON YEAR
2%
INCREASE
YEAR ON YEAR
NON-GAAP REVENUES(1)
2011 2012
$4.8B
$4.9B
2011 2012
$4.5B
$
5.0 B
(1)
For a full reconciliation, see tables
at the end of the annual report.
ACTIVISION BLIZZARD, INC.
/ 2012 ANNUAL REPORT / 2