Activision 2012 Annual Report Download - page 10
Download and view the complete annual report
Please find page 10 of the 2012 Activision annual report below. You can navigate through the pages in the report by either clicking on the pages listed below, or by using the keyword search tool below to find specific information within the annual report.-
 1
1 -
 2
2 -
 3
3 -
 4
4 -
 5
5 -
 6
6 -
 7
7 -
 8
8 -
 9
9 -
 10
10 -
 11
11 -
 12
12 -
 13
13 -
 14
14 -
 15
15 -
 16
16 -
 17
17 -
 18
18 -
 19
19 -
 20
20 -
 21
21 -
22
-
23
-
24
-
25
-
26
-
27
-
28
-
29
-
30
-
31
-
32
-
33
-
34
-
35
-
36
-
37
-
38
-
39
-
40
-
41
-
42
-
43
-
44
-
45
-
46
-
47
-
48
-
49
-
50
-
51
-
52
-
53
-
54
-
55
-
56
-
57
-
58
-
59
-
60
-
61
-
62
-
63
-
64
-
65
-
66
-
67
-
68
-
69
-
70
-
71
-
72
-
73
-
74
-
75
-
76
-
77
-
78
-
79
-
80
-
81
-
82
-
83
-
84
-
85
-
86
-
87
-
88
-
89
-
90
-
91
-
92
-
93
-
94
-
95
-
96
-
97
-
98
-
99
-
100
 |
 |

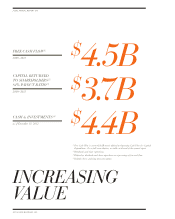
INCREASING
VALUE
(1)
Free Cash Flow is a non-GAAP metric defined as Operating Cash Flow less Capital
Expenditures. For a full reconciliation, see tables at the end of the annual report.
(2)
Dividends and share repurchases.
(3)
Defined as dividends and share repurchases as a percentage of free cash flow.
(4)
Includes short- and long-term investments.
FREE CASH FLOW(1)
2009–2012
CASH & INVESTMENTS(4)
as of December 31, 2012
CAPITAL RETURNED
TO SHAREHOLDERS(2)
81% PAYOUT RATIO(3)
2009–2012
$4.5 B
$3.7 B
$4 .4 B
ACTIVISION BLIZZARD, INC.
/ 2012 ANNUAL REPORT / 8