Aarons 2002 Annual Report Download - page 3
Download and view the complete annual report
Please find page 3 of the 2002 Aarons annual report below. You can navigate through the pages in the report by either clicking on the pages listed below, or by using the keyword search tool below to find specific information within the annual report.-
 1
1 -
 2
2 -
 3
3 -
 4
4 -
 5
5 -
 6
6 -
 7
7 -
 8
8 -
 9
9 -
 10
10 -
 11
11 -
 12
12 -
 13
13 -
 14
14 -
15
-
16
-
17
-
18
-
19
-
20
-
21
-
22
-
23
-
24
-
25
-
26
-
27
-
28
-
29
-
30
-
31
-
32
-
33
-
34
-
35
-
36
 |
 |

1
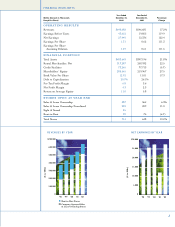
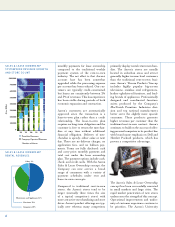
REVENUES BY YEAR NET EARNINGS BY YEAR
Year Ended Year Ended
(Dollar Amounts in Thousands, December 31, December 31, Percentage
Except Per Share) 2002 2001 Change
OPERATING RESULTS
Revenues $640,688 $546,681 17.2%
Earnings Before Taxes 43,652 19,855 119.9
Net Earnings 27,440 12,336 122.4
Earnings Per Share 1.31 0.62 111.3
Earnings Per Share
Assuming Dilution 1.29 0.61 111.5
FINANCIAL POSITION
Total Assets $483,648 $397,196 21.8%
Rental Merchandise, Net 317,287 258,932 22.5
Credit Facilities 73,265 77,713 (5.7)
Shareholders’ Equity 280,545 219,967 27.5
Book Value Per Share 12.92 11.01 17.3
Debt to Capitalization 20.7% 26.1%
Pre-Tax Profit Margin 6.8 3.6
Net Profit Margin 4.3 2.3
Return on Average Equity 11.0 5.8
STORES OPEN AT YEAR END
Sales & Lease Ownership 387 364 6.3%
Sales & Lease Ownership Franchised 232 209 11.0
Sight & Sound 25
Rent-to-Rent 70 75 (6.7)
Total Stores 714 648 10.2%
FINANCIAL HIGHLIGHTS
’98
’99 ’00 ’01 ’02
$700,000
600,000
500,000
400,000
300,000
200,000
100,000
0
($ in 000s)
Rent-to-Rent Stores
Company-Operated Sales
& Lease Ownership Stores
’98
’99 ’00 ’01 ’02
$30,000
25,000
20,000
15,000
10,000
5,000
0
($ in 000s)