Aarons 2002 Annual Report Download - page 16
Download and view the complete annual report
Please find page 16 of the 2002 Aarons annual report below. You can navigate through the pages in the report by either clicking on the pages listed below, or by using the keyword search tool below to find specific information within the annual report.-
 1
1 -
2
-
3
-
4
-
5
-
 6
6 -
 7
7 -
 8
8 -
 9
9 -
 10
10 -
 11
11 -
 12
12 -
 13
13 -
 14
14 -
 15
15 -
 16
16 -
 17
17 -
 18
18 -
 19
19 -
 20
20 -
 21
21 -
 22
22 -
 23
23 -
 24
24 -
 25
25 -
 26
26 -
27
-
28
-
29
-
30
-
31
-
32
-
33
-
34
-
35
-
36
 |
 |

14
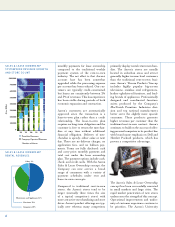
SELECTED FINANCIAL INFORMATION
Year Ended Year Ended Year Ended Year Ended Year Ended
(Dollar Amounts in Thousands, December 31, December 31, December 31, December 31, December 31,
Except Per Share) 2002 2001 2000 1999 1998
Systemwide Revenues1$874,709 $735,389 $656,096 $547,255 $464,175
OPERATING RESULTS
Revenues:
Rentals & Fees $459,179 $403,385 $359,880 $318,154 $289,272
Retail Sales 72,698 60,481 62,417 62,296 62,576
Non-Retail Sales 88,969 66,212 65,498 45,394 18,985
Other 19,842 16,603 15,125 11,515 8,826
640,688 546,681 502,920 437,359 379,659
Costs & Expenses:
Retail Cost of Sales 53,856 43,987 44,156 45,254 44,386
Non-Retail Cost of Sales 82,407 61,999 60,996 42,451 17,631
Operating Expenses 293,346 276,682 227,587 201,923 189,719
Depreciation of Rental Merchandise 162,660 137,900 120,650 102,324 89,171
Interest 4,767 6,258 5,625 4,105 3,561
597,036 526,826 459,014 396,057 344,468
Earnings Before Income Taxes 43,652 19,855 43,906 41,302 35,191
Income Taxes 16,212 7,519 16,645 15,700 13,707
Net Earnings $ 27,440 $ 12,336 $ 27,261 $ 25,602 $ 21,484
Earnings Per Share $ 1.31 $ .62 $ 1.38 $ 1.28 $ 1.06
Earnings Per Share Assuming Dilution 1.29 .61 1.37 1.26 1.04
Dividends Per Share:
Common $ .04 $ .04 $ .04 $ .04 $ .04
Class A .04 .04 .04 .04 .04
FINANCIAL POSITION
Rental Merchandise, Net $317,287 $258,932 $267,713 $219,831 $194,163
Property, Plant &
Equipment, Net 87,094 77,282 63,174 55,918 50,113
Total Assets 483,648 397,196 380,379 318,408 272,174
Interest-Bearing Debt 73,265 77,713 104,769 72,760 51,727
Shareholders’ Equity 280,545 219,967 208,538 183,718 168,871
AT YEAR END
Stores Open:
Company-Operated 482 439 361 320 291
Franchised 232 209 193 155 136
Rental Agreements in Effect 369,000 314,600 281,000 254,000 227,400
Number of Employees 4,800 4,200 3,900 3,600 3,400
1Systemwide revenues include revenues of franchised Aaron’s Sales & Lease Ownership stores. Franchised store revenues are not revenues of Aaron Rents.
The Company adopted Statement of Financial Accounting
Standards No. 142, Goodwill and Other Intangible Assets on January
1, 2002. If the Company had applied the non-amortization provi-
sions of Statement 142 for all periods presented, net income and
diluted income per share would have increased by approximately
$688,000 ($.03 per share), $431,000 ($.02 per share), $323,000
($.02 per share), and $173,000 ($.01 per share) for the years ended
December 31, 2001, 2000, 1999, and 1998, respectively.