Aarons 2000 Annual Report Download - page 3
Download and view the complete annual report
Please find page 3 of the 2000 Aarons annual report below. You can navigate through the pages in the report by either clicking on the pages listed below, or by using the keyword search tool below to find specific information within the annual report.-
 1
1 -
 2
2 -
 3
3 -
 4
4 -
 5
5 -
 6
6 -
 7
7 -
 8
8 -
 9
9 -
 10
10 -
 11
11 -
 12
12 -
 13
13 -
 14
14 -
15
-
16
-
17
-
18
-
19
-
20
-
21
-
22
-
23
-
24
-
25
-
26
-
27
-
28
-
29
-
30
-
31
-
32
 |
 |

1
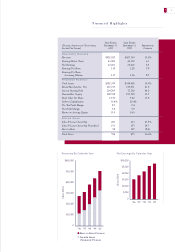
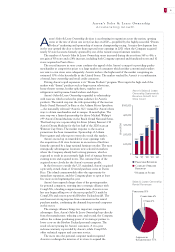
Financial Highlights
Revenues By Calendar Year Net Earnings By Calendar Year
Year Ended Year Ended
(Dollar Amounts in Thousands, December 31, December 31, Percentage
Except Per Share) 2000 1999 Change
Operating Results
Revenues $502,920 $437,359 15.0%
Earnings Before Taxes 43,906 41,302 6.3
Net Earnings 27,261 25,602 6.5
Earnings Per Share 1.38 1.28 7.8
Earnings Per Share
Assuming Dilution 1.37 1.26 8.7
Financial Position
Total Assets $380,379 $318,408 19.5%
Rental Merchandise, Net 267,713 219,831 21.8
Interest-Bearing Debt 104,769 72,760 44.0
Shareholders’ Equity 208,538 183,718 13.5
Book Value Per Share 10.50 9.22 13.8
Debt to Capitalization 33.4% 28.4%
Pre-Tax Profit Margin 8.7 9.4
Net Profit Margin 5.4 5.9
Return on Average Equity 13.9 14.5
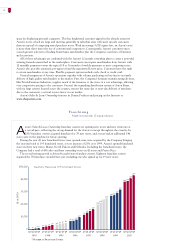
Stores Open
Sales & Lease Ownership 263 213 23.5%
Sales & Lease Ownership Franchised 193 155 24.5
Rent-to-Rent 98 107 (8.4)
Total Stores 554 475 16.6%
$30,000
25,000
20,000
15,000
10,000
5,000
0
’96
’97
’98
’99 ’00
($ in 000s)
’96
’97
’98
’99 ’00
$600,000
500,000
400,000
300,000
200,000
100,000
0
Rent-to-Rent Division
Sales & Lease
Ownership Division
($ in 000s)