Aarons 2000 Annual Report Download - page 16
Download and view the complete annual report
Please find page 16 of the 2000 Aarons annual report below. You can navigate through the pages in the report by either clicking on the pages listed below, or by using the keyword search tool below to find specific information within the annual report.-
 1
1 -
2
-
3
-
4
-
5
-
 6
6 -
 7
7 -
 8
8 -
 9
9 -
 10
10 -
 11
11 -
 12
12 -
 13
13 -
 14
14 -
 15
15 -
 16
16 -
 17
17 -
 18
18 -
 19
19 -
 20
20 -
 21
21 -
 22
22 -
 23
23 -
 24
24 -
 25
25 -
 26
26 -
27
-
28
-
29
-
30
-
31
-
32
 |
 |

14
Results of Operations
Year Ended December 31, 2000 versus Year Ended
December 31, 1999
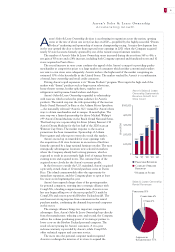
Total revenues for 2000 increased $65.6 million
(15.0%) to $502.9 million compared to $437.4 million
in 1999 due primarily to a $41.7 million (13.1%) increase
in rentals and fees revenues, plus a $20.1 million (44.3%)
increase in non-retail sales. Of this increase in rentals and
fees revenues, $37.7 million was attributable to Aaron’s
Sales & Lease Ownership, the Company’s rental purchase
division. Rentals and fees revenues from the Company’s
rent-to-rent operations increased $4.0 million during the
same period.
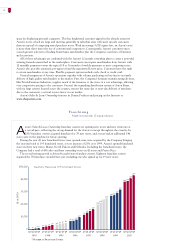
Revenues from retail sales increased $121,000 (.2%)
to $62.4 million in 2000, from $62.3 million for the
same period last year. Non-retail sales, which primarily
represent merchandise sold to Aaron’s Sales & Lease
Ownership franchisees, increased $20.1 million (44.3%)
to $65.5 million compared to $45.4 million for the same
period last year. The increased sales are due to the growth
of the franchise operations.
Other revenues for 2000 increased $3.6 million
(31.4%) to $15.1 million compared to $11.5 million in
1999. This increase was attributable to franchise fee and
royalty income increasing $3.3 million (36.3%) to $12.4
million compared to $9.1 million last year, reflecting the
net addition of 38 new franchised stores in 2000 and
improved operating revenues at mature franchised stores.
Cost of sales from retail sales decreased $1.1 million
(2.4%) to $44.2 million compared to $45.3 million, and
as a percentage of sales, decreased to 70.7% from 72.6%
primarily due to product mix. Cost of sales from non-retail
sales increased $18.5 million (43.7%) to $61.0 million
from $42.5 million, and as a percentage of sales, decreased
to 93.1% from 93.5%. The increased margins on non-retail
sales was primarily the result of slightly higher margins on
certain products sold to franchisees.
Operating expenses increased $25.7 million (12.7%)
to $227.6 million from $201.9 million. As a percentage of
total revenues, operating expenses were 45.3% in 2000
and 46.2% in 1999. Operating expenses decreased as
a percentage of total revenues between years primarily
due to increased revenues in the Aaron’s Sales & Lease
Ownership division.
Depreciation of rental merchandise increased $18.3
million (17.9%) to $120.7 million, from $102.3 million,
and as a percentage of total rentals and fees increased to
33.5% from 32.2% in 1999. The increase as a percentage
of rentals and fees is primarily due to a greater percentage
of the Company’s rentals and fees coming from the
Aaron’s Sales & Lease Ownership division which depre-
ciates its rental merchandise at a faster rate than the
rent-to-rent division.
Interest expense increased $1.5 million (37.0%) to
$5.6 million compared to $4.1 million. As a percentage
of total revenues, interest expense was 1.1% in 2000
compared to .9% in 1999. The increase in interest expense
as a percentage of revenues was due to increased interest
rates along with higher daily average debt levels.
Management’s Discussion and Analysis of
Financial Condition and Results of Operations
The Company manages its exposure to changes in
short-term interest rates, particularly to reduce the impact
on its floating-rate revolving credit facility, by entering
into interest rate swap agreements. The counterparties to
these contracts are high credit quality commercial banks.
Consequently, credit risk, which is inherent in all swaps,
has been minimized to a large extent. Interest expense
is adjusted for the differential to be paid or received as
interest rates change. The effect of such adjustments on
interest expense has not been significant. The level of
floating-rate debt fixed by swap agreements was $40.0
million during the year and the Company does not expect
a significant change in this amount in 2001. Accordingly,
the Company does not believe it has material exposure
of potential near-term losses in future earnings, and/or
cash flows from reasonably possible near-term changes
in market rates.
Income tax expense increased $945,000 (6.0%) to
$16.6 million compared to $15.7 million. The Company’s
effective tax rate was 37.9% in 2000 compared to 38.0%
in 1999.
As a result, net earnings increased $1.7 million (6.5%)
to $27.3 million for 2000 compared to $25.6 million for
the same period in 1999. As a percentage of total revenues,
net earnings were 5.4% in 2000 and 5.9% in 1999.
The decrease in net earnings as a percentage of total
revenues is the result of startup losses associated with the
increased rate at which the Company opened new Aaron’s
Sales & Lease Ownership stores with 32 stores opened in
2000 compared to 17 in 1999.
Year Ended December 31, 1999 versus Year Ended
December 31, 1998
Total revenues for 1999 increased $57.7 million (15.2%)
to $437.4 million compared to $379.7 million in 1998 due
primarily to a $28.9 million (10.0%) increase in rentals
and fees revenues, plus a $26.4 million (139.1%) increase
in non-retail sales. Of this increase in rentals and fees
revenues, $32.7 million was attributable to the Aaron’s
Sales & Lease Ownership division. Rentals and fees from
the Company’s rent-to-rent operations increased $2.0
million excluding $5.8 million of rentals and fees from
the Company’s convention furnishings division, which
was sold in the fourth quarter of 1998.
Revenues from retail sales decreased $280,000 (.4%)
to $62.3 million in 1999 from $62.6 million for the same
period in 1998. The decrease was the result of new sales
in the rent-to-rent division decreasing and the discon-
tinued sale of prepaid cellular air time in the rental
purchase division. Non-retail sales, which primarily
represent merchandise sold to Aaron’s Sales & Lease
Ownership franchisees, increased $26.4 million (139.1%)
to $45.4 million compared to $19.0 million for the same
period in 1998. The increased sales are due to the growth
of the franchise operations coupled with the addition of a
new distribution center.