Aarons 2000 Annual Report Download - page 17
Download and view the complete annual report
Please find page 17 of the 2000 Aarons annual report below. You can navigate through the pages in the report by either clicking on the pages listed below, or by using the keyword search tool below to find specific information within the annual report.-
 1
1 -
2
-
3
-
4
-
5
-
6
-
 7
7 -
 8
8 -
 9
9 -
 10
10 -
 11
11 -
 12
12 -
 13
13 -
 14
14 -
 15
15 -
 16
16 -
 17
17 -
 18
18 -
 19
19 -
 20
20 -
 21
21 -
 22
22 -
 23
23 -
 24
24 -
 25
25 -
 26
26 -
 27
27 -
28
-
29
-
30
-
31
-
32
 |
 |

15
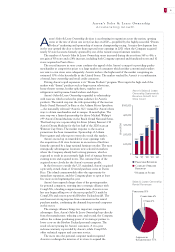
Other revenues for 1999 increased $2.7 million (30.5%)
to $11.5 million compared to $8.8 million in 1998. This
increase was attributable to franchise fee and royalty
income increasing $1.8 million (25.3%) to $9.1 million
compared to $7.3 million in 1998, reflecting the net
addition of 19 new franchised stores in 1999 and
increasing operating revenues at mature franchised stores.
Cost of sales from retail sales increased $868,000
(2.0%) to $45.3 million compared to $44.4 million, and
as a percentage of sales, increased slightly to 72.6% from
70.9% primarily due to product mix. Cost of sales from
non-retail sales increased $24.8 million (140.8%) to $42.5
million from $17.6 million, and as a percentage of sales,
increased to 93.5% from 92.9%. The reduced margins on
non-retail sales was primarily the result of lower margins
on certain products sold to franchisees.
Operating expenses increased $12.2 million (6.4%) to
$201.9 million from $189.7 million. As a percentage of
total revenues, operating expenses were 46.2% in 1999
and 50.0% in 1998. Operating expenses decreased as a
percentage of total revenues between years primarily due to
increased revenues in the Aaron’s Sales & Lease Ownership
division and the sale of the Company’s convention furnish-
ings division which had higher operating expenses than
traditional rent-to-rent and rental purchase operations.
Depreciation of rental merchandise increased $13.2
million (14.8%) to $102.3 million, from $89.2 million,
and as a percentage of total rentals and fees, was 32.2%
compared to 30.8% in 1998. The increase as a percentage
of rentals and fees is primarily due to a greater percentage
of the Company’s rentals and fees coming from the
Aaron’s Sales & Lease Ownership division which depre-
ciates its rental merchandise at a faster rate than the
rent-to-rent division.
Interest expense increased $544,000 (15.3%) to $4.1
million compared to $3.6 million. As a percentage of total
revenues, interest expense remained unchanged at 0.9%.
Income tax expense increased $2.0 million (14.5%) to
$15.7 million compared to $13.7 million. The Company’s
effective tax rate was 38.0% in 1999 compared to 39.0%
in 1998.
As a result, net earnings increased $4.1 million (19.2%)
to $25.6 million for 1999 compared to $21.5 million for
the same period in 1998. As a percentage of total revenues,
net earnings were 5.9% in 1999 and 5.7% in 1998.
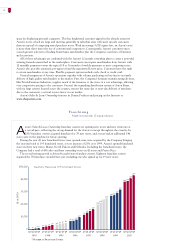
Liquidity and Capital Resources
Cash flows from operations for the years ended
December 31, 2000 and 1999 were $166.2 million and
$140.3 million, respectively. Such cash flows include
profits on the sale of rental return merchandise. The
Company’s primary capital requirements consist of
acquiring rental merchandise for both rent-to-rent and
Company-operated Aaron’s Sales & Lease Ownership
stores. As the Company continues to grow, the need for
additional rental merchandise will continue to be the
Company’s major capital requirement. These capital
requirements historically have been financed through
bank credit, cash flow from operations, trade credit,
proceeds from the sale of rental return merchandise
and stock offerings.
The Company has financed its growth through a
revolving credit agreement with several banks, trade
credit and internally generated funds. The revolving credit
agreement provides for unsecured borrowings up to $90.0
million which includes a $6.0 million credit line to fund
daily working capital requirements. At December 31, 2000,
an aggregate of $90.0 million was outstanding under this
facility, bearing interest at a weighted average variable rate
of 7.04%. The Company uses interest rate swap agreements
as part of its overall long-term financing program. At
December 31, 2000, the Company had swap agreements
with notional principal amounts of $40.0 million which
effectively fixed the interest rates on an equal amount of
the Company’s revolving credit agreement at 6.93%.
In 2000, the Company entered into a credit agreement
with two banks providing for unsecured borrowings up
to $10,000,000. At December 31, 2000 and aggregate of
$10,000,000 bearing interest at libor plus 1.00% was out-
standing under the agreement. The debt matures in 2001.
In addition, the Company issued $4,200,000 of industrial
development corporation revenue bonds. The average
weighted borrowing rate on these bonds in 2000 was 4.55%.
No principal payments are due on the bonds until maturity
in 2015.
On April 28, 1998, the Company issued through a
public offering 2.1 million shares of Common Stock. The
net proceeds to the Company after deducting underwriting
discounts and offering expenses were $40.0 million. The
proceeds were used to reduce bank debt.
The Company believes that the expected cash flows
from operations, proceeds from the sale of rental return
merchandise, bank borrowings and vendor credit will be
sufficient to fund the Company’s capital and liquidity
needs for at least the next 24 months.
During 2000, 327,500 shares of the Company’s stock
were purchased at an aggregate cost of $4.6 million and
the Company was authorized to purchase an additional
1,284,690 shares at December 31, 2000.
The Company has paid dividends for fourteen con-
secutive years. A $.02 per share dividend on Common
Stock and on Class A Common Stock was paid in January
2000 and July 2000, for a total fiscal year cash outlay of
$792,000. The Company currently expects to continue
its policy of paying dividends.