AT&T Uverse 2010 Annual Report Download - page 73
Download and view the complete annual report
Please find page 73 of the 2010 AT&T Uverse annual report below. You can navigate through the pages in the report by either clicking on the pages listed below, or by using the keyword search tool below to find specific information within the annual report.-
 1
1 -
2
-
3
-
4
-
5
-
6
-
7
-
8
-
9
-
10
-
11
-
12
-
13
-
14
-
15
-
16
-
17
-
18
-
19
-
20
-
21
-
22
-
23
-
24
-
25
-
26
-
27
-
28
-
29
-
30
-
31
-
32
-
33
-
34
-
35
-
36
-
37
-
38
-
39
-
40
-
41
-
42
-
43
-
44
-
45
-
46
-
47
-
48
-
49
-
50
-
51
-
52
-
53
-
54
-
55
-
56
-
57
-
58
-
59
-
60
-
61
-
62
-
 63
63 -
 64
64 -
 65
65 -
 66
66 -
 67
67 -
 68
68 -
 69
69 -
 70
70 -
 71
71 -
 72
72 -
 73
73 -
 74
74 -
 75
75 -
 76
76 -
 77
77 -
 78
78 -
 79
79 -
 80
80 -
 81
81 -
 82
82 -
 83
83 -
84
-
85
-
86
-
87
-
88
-
89
-
90
-
91
-
92
-
93
-
94
-
95
-
96
-
97
-
98
-
99
-
100
-
101
-
102
-
103
-
104
 |
 |

AT&T Inc. 71
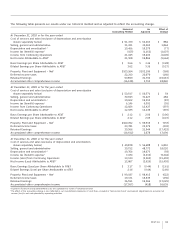
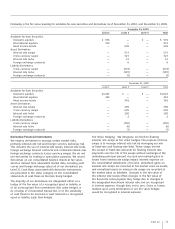
Segment results, including a reconciliation to AT&T consolidated results, for 2010, 2009 and 2008 are as follows:
Advertising Consolidated
At December 31, 2010 or for the year ended Wireless Wireline Solutions Other Consolidations Results
Total segment operating revenues $ 58,500 $ 61,202 $3,935 $ 643 $ — $124,280
Operations and support expenses 36,746 41,008 2,583 2,470 2,521 85,328
Depreciation and amortization expenses 6,497 12,371 497 14 — 19,379
Total segment operating expenses 43,243 53,379 3,080 2,484 2,521 104,707
Segment operating income (loss) 15,257 7,823 855 (1,841) (2,521) 19,573
Interest expense — — — — 2,994 2,994
Equity in net income of affiliates 9 11 — 742 — 762
Other income (expense) – net — — — — 897 897
Segment income (loss) before income taxes $ 15,266 $ 7,834 $ 855 $(1,099) $ (4,618) $ 18,238
Segment assets $122,011 $149,230 $8,736 $ 9,067 $(20,556) $268,488
Investments in equity method affiliates 14 — — 4,501 — 4,515
Expenditures for additions to long-lived assets 9,171 11,071 29 31 — 20,302
Advertising Consolidated
At December 31, 2009 or for the year ended Wireless Wireline Solutions Other Consolidations Results
Total segment operating revenues $ 53,504 $ 63,514 $4,724 $ 771 $ — $122,513
Operations and support expenses 33,631 42,352 2,743 3,057 215 81,998
Depreciation and amortization expenses 6,043 12,743 650 79 — 19,515
Total segment operating expenses 39,674 55,095 3,393 3,136 215 101,513
Segment operating income (loss) 13,830 8,419 1,331 (2,365) (215) 21,000
Interest expense — — — — 3,368 3,368
Equity in net income of affiliates 9 17 — 708 — 734
Other income (expense) – net — — — — 152 152
Segment income (loss) before income taxes $ 13,839 $ 8,436 $1,331 $(1,657) $ (3,431) $ 18,518
Segment assets $116,720 $156,130 $9,654 $ 8,908 $(23,100) $268,312
Investments in equity method affiliates 4 — — 2,917 — 2,921
Expenditures for additions to long-lived assets 6,066 11,200 22 6 — 17,294
Advertising Consolidated
For the year ended December 31, 2008 Wireless Wireline Solutions Other Consolidations Results
Total segment operating revenues $ 49,174 $ 67,890 $5,416 $ 963 $ — $123,443
Operations and support expenses 31,530 44,817 2,900 1,063 25,150 105,460
Depreciation and amortization expenses 6,025 12,786 789 73 — 19,673
Total segment operating expenses 37,555 57,603 3,689 1,136 25,150 125,133
Segment operating income (loss) 11,619 10,287 1,727 (173) (25,150) (1,690)
Interest expense — — — — 3,369 3,369
Equity in net income of affiliates 6 19 — 794 — 819
Other income (expense) – net — — — — (332) (332)
Segment income (loss) before income taxes $ 11,625 $ 10,306 $1,727 $ 621 $(28,851) $ (4,572)