AT&T Uverse 2010 Annual Report Download - page 71
Download and view the complete annual report
Please find page 71 of the 2010 AT&T Uverse annual report below. You can navigate through the pages in the report by either clicking on the pages listed below, or by using the keyword search tool below to find specific information within the annual report.-
 1
1 -
2
-
3
-
4
-
5
-
6
-
7
-
8
-
9
-
10
-
11
-
12
-
13
-
14
-
15
-
16
-
17
-
18
-
19
-
20
-
21
-
22
-
23
-
24
-
25
-
26
-
27
-
28
-
29
-
30
-
31
-
32
-
33
-
34
-
35
-
36
-
37
-
38
-
39
-
40
-
41
-
42
-
43
-
44
-
45
-
46
-
47
-
48
-
49
-
50
-
51
-
52
-
53
-
54
-
55
-
56
-
57
-
58
-
59
-
60
-
 61
61 -
 62
62 -
 63
63 -
 64
64 -
 65
65 -
 66
66 -
 67
67 -
 68
68 -
 69
69 -
 70
70 -
 71
71 -
 72
72 -
 73
73 -
 74
74 -
 75
75 -
 76
76 -
 77
77 -
 78
78 -
 79
79 -
 80
80 -
 81
81 -
82
-
83
-
84
-
85
-
86
-
87
-
88
-
89
-
90
-
91
-
92
-
93
-
94
-
95
-
96
-
97
-
98
-
99
-
100
-
101
-
102
-
103
-
104
 |
 |

AT&T Inc. 69
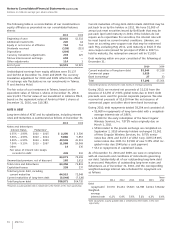
During the second quarter of 2010, we accounted for Sterling
as a discontinued operation. We determined that the cash
inflows under the transition services agreement and our cash
outflows under the enterprise license agreement will not
constitute significant continuing involvement with Sterling’s
operations after the sale. We have reclassified Sterling’s
operating results, for all historical periods, to income from
discontinued operations in the accompanying consolidated
statements of income. We also applied held-for-sale treatment
to Sterling’s assets and liabilities, and, accordingly, included
Sterling’s assets in other current assets, and the related
liabilities in accounts payable and accrued liabilities, on our
consolidated balance sheets. Sterling’s assets and liabilities
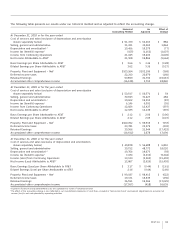
included the following as of December 31:
2009
Assets held for sale:
Current assets $ 333
Property, plant and equipment 40
Goodwill and other intangible assets 672
Other assets 47
Total assets $1,092
Liabilities related to assets held for sale:
Current liabilities $ 365
Other liabilities 126
Total liabilities $ 491
The following table includes Sterling’s operating results, which
we historically included in our Other segment:
Aug. 27, Dec. 31, Dec. 31,
2010 2009 2008
Operating revenues $349 $563 $633
Operating expenses 327 523 616
Operating income 22 40 17
Income (loss) before income taxes 18 29 (1)
Income tax expense 8 9 1
Income (loss) from discontinued
operations during
phase-out period 10 20 (2)
Gain on disposal of discontinued
operations 769 — —
Income (loss) from discontinued
operations, net of tax $779 $ 20 $ (2)
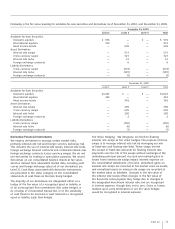
Centennial In October 2009, the DOJ cleared our acquisition
of Centennial, subject to the DOJ’s condition that we divest
Centennial’s operations in eight service areas in Louisiana and
Mississippi. In August 2010, we sold those eight service areas
for $273 in cash.
Other Dispositions In 2010, we also sold our domestic
Japanese outsourcing services company for $109. In 2009,
we sold a professional services business for $174 and
eliminated $113 of goodwill. In 2008, we sold to Local Insight
Regatta Holdings Inc., the parent company of Local Insight
Yellow Pages, the Independent Line of Business segment
of the L.M. Berry Company, for $230.
Other Adjustments During 2010, we recorded $78 in
reductions of Dobson Communications Corporation and
BellSouth Corporation (BellSouth) restructuring liabilities
previously included in the purchase accounting for those
deals, and we recorded an offsetting reduction of goodwill.
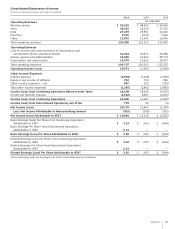
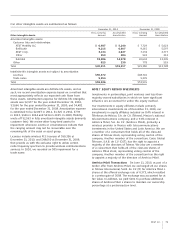
NOTE 3. EARNINGS PER SHARE
A reconciliation of the numerators and denominators of
basic earnings per share and diluted earnings per share for
income from continuing operations for the years ended
December 31, 2010, 2009 and 2008, are shown in the
table below:
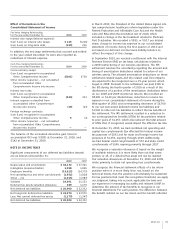
Year Ended December 31, 2010 2009 2008
Numerators
Numerator for basic earnings
per share:
Income (loss) from continuing
operations $19,400 $12,427 $(2,362)
Income attributable to
noncontrolling interest (315) (309) (261)
Income (loss) from continuing
operations attributable to AT&T 19,085 12,118 (2,623)
Dilutive potential common shares:
Other share-based payment 11 10 9
Numerator for diluted earnings
per share $19,096 $12,128 $(2,614)
Denominators (000,000)
Denominator for basic earnings
per share:
Weighted-average number of
common shares outstanding 5,913 5,900 5,927
Dilutive potential common
shares:
Stock options 3 3 9
Other share-based payment 22 21 22
Denominator for diluted earnings
per share 5,938 5,924 5,958
Basic earnings (loss) per share
from continuing operations
attributable to AT&T $ 3.23 $ 2.06 $ (0.44)
Basic earnings per share from
discontinued operations
attributable to AT&T 0.13 — —
Basic earnings (loss) per share
attributable to AT&T $ 3.36 $ 2.06 $ (0.44)
Diluted earnings (loss) per share
from continuing operations
attributable to AT&T $ 3.22 $ 2.05 $ (0.44)
Diluted earnings per share from
discontinued operations
attributable to AT&T 0.13 — —
Diluted earnings (loss) per share
attributable to AT&T $ 3.35 $ 2.05 $ (0.44)