AT&T Uverse 2010 Annual Report Download - page 32
Download and view the complete annual report
Please find page 32 of the 2010 AT&T Uverse annual report below. You can navigate through the pages in the report by either clicking on the pages listed below, or by using the keyword search tool below to find specific information within the annual report.-
 1
1 -
2
-
3
-
4
-
5
-
6
-
7
-
8
-
9
-
10
-
11
-
12
-
13
-
14
-
15
-
16
-
17
-
18
-
19
-
20
-
21
-
 22
22 -
 23
23 -
 24
24 -
 25
25 -
 26
26 -
 27
27 -
 28
28 -
 29
29 -
 30
30 -
 31
31 -
 32
32 -
 33
33 -
 34
34 -
 35
35 -
 36
36 -
 37
37 -
 38
38 -
 39
39 -
 40
40 -
 41
41 -
 42
42 -
43
-
44
-
45
-
46
-
47
-
48
-
49
-
50
-
51
-
52
-
53
-
54
-
55
-
56
-
57
-
58
-
59
-
60
-
61
-
62
-
63
-
64
-
65
-
66
-
67
-
68
-
69
-
70
-
71
-
72
-
73
-
74
-
75
-
76
-
77
-
78
-
79
-
80
-
81
-
82
-
83
-
84
-
85
-
86
-
87
-
88
-
89
-
90
-
91
-
92
-
93
-
94
-
95
-
96
-
97
-
98
-
99
-
100
-
101
-
102
-
103
-
104
 |
 |

30 AT&T Inc.
Selected Financial and Operating Data
Dollars in millions except per share amounts
At December 31 or for the year ended: 2010 20091 20081 20071 20061,2
As Adjusted
Financial Data
Operating revenues $124,280 $122,513 $123,443 $118,322 $ 62,518
Operating expenses $104,707 $101,513 $125,133 $ 89,181 $ 44,521
Operating income (loss) $ 19,573 $ 21,000 $ (1,690) $ 29,141 $ 17,997
Interest expense $ 2,994 $ 3,368 $ 3,369 $ 3,460 $ 1,800
Equity in net income of affiliates $ 762 $ 734 $ 819 $ 692 $ 2,043
Other income (expense) – net $ 897 $ 152 $ (332) $ 814 $ 398
Income tax expense (benefit) $ (1,162) $ 6,091 $ (2,210) $ 9,917 $ 6,088
Net Income (Loss) $ 20,179 $ 12,447 $ (2,364) $ 17,228 $ 12,547
Less: Net Income Attributable to
Noncontrolling Interest $ (315) $ (309) $ (261) $ (196) $ (5)
Net Income (Loss) Attributable to AT&T $ 19,864 $ 12,138 $ (2,625) $ 17,032 $ 12,542
Earnings (Loss) Per Common Share:
Net Income (Loss) Attributable to AT&T $ 3.36 $ 2.06 $ (0.44) $ 2.78 $ 3.23
Earnings (Loss) Per Common Share – Assuming Dilution:
Net Income (Loss) Attributable to AT&T $ 3.35 $ 2.05 $ (0.44) $ 2.76 $ 3.22
Total assets $268,488 $268,312 $264,700 $274,951 $270,118
Long-term debt $ 58,971 $ 64,720 $ 60,872 $ 57,253 $ 50,062
Total debt $ 66,167 $ 72,081 $ 74,990 $ 64,112 $ 59,795
Construction and capital expenditures $ 20,302 $ 17,294 $ 20,290 $ 17,831 $ 8,337
Dividends declared per common share $ 1.69 $ 1.65 $ 1.61 $ 1.47 $ 1.35
Book value per common share $ 18.94 $ 17.28 $ 16.35 $ 19.07 $ 18.52
Ratio of earnings to fixed charges6 4.52 4.42 — 6.95 8.67
Debt ratio 37.1% 41.4% 43.8% 35.7% 34.1%
Weighted average common shares
outstanding (000,000) 5,913 5,900 5,927 6,127 3,882
Weighted average common shares
outstanding with dilution (000,000) 5,938 5,924 5,958 6,170 3,902
End of period common shares outstanding (000,000) 5,911 5,902 5,893 6,044 6,239
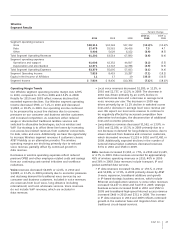
Operating Data
Wireless connections (000)3 95,536 85,120 77,009 70,052 60,962
In-region network access lines in service (000) 43,678 49,392 55,610 61,582 66,469
Broadband connections (000)4,5 17,755 17,254 16,265 14,802 12,170
Number of employees 266,590 282,720 302,660 309,050 304,180
1
Financial data for 2006 – 2009 has been adjusted to reflect our voluntary change in accounting for pension and postretirement benefits. See Note 1 to consolidated financial
statements.
2 Our 2006 income statement amounts reflect results from BellSouth Corporation (BellSouth) and AT&T Mobility LLC (AT&T Mobility), formerly Cingular Wireless LLC, for the two
days following the December 29, 2006 acquisition. Our 2006 balance sheet and end-of-year metrics include 100% of BellSouth and AT&T Mobility. Prior to the December 29, 2006
BellSouth acquisition, AT&T Mobility was a joint venture in which we owned 60% and was accounted for under the equity method.
3 The number presented represents 100% of AT&T Mobility cellular/PCS customers.
4 Broadband connections include in-region DSL lines, in-region U-verse High Speed Internet access, satellite broadband and 3G LaptopConnect cards.
5 Prior-period amounts restated to conform to current period reporting methodology.
6 Earnings were not sufficient to cover fixed charges in 2008. The deficit was $943.