AIG 2005 Annual Report Download - page 3
Download and view the complete annual report
Please find page 3 of the 2005 AIG annual report below. You can navigate through the pages in the report by either clicking on the pages listed below, or by using the keyword search tool below to find specific information within the annual report.-
 1
1 -
 2
2 -
 3
3 -
 4
4 -
 5
5 -
 6
6 -
 7
7 -
 8
8 -
 9
9 -
 10
10 -
 11
11 -
 12
12 -
 13
13 -
 14
14 -
15
-
16
-
17
-
18
-
19
-
20
-
21
-
22
-
23
-
24
-
25
-
26
-
27
-
28
-
29
-
30
-
31
-
32
-
33
-
34
-
35
-
36
-
37
-
38
-
39
-
40
-
41
-
42
-
43
-
44
-
45
-
46
-
47
-
48
-
49
-
50
-
51
-
52
-
53
-
54
-
55
-
56
-
57
-
58
-
59
-
60
-
61
-
62
-
63
-
64
-
65
-
66
-
67
-
68
-
69
-
70
-
71
-
72
-
73
-
74
-
75
-
76
-
77
-
78
-
79
-
80
-
81
-
82
-
83
-
84
-
85
-
86
-
87
-
88
-
89
-
90
-
91
-
92
-
93
-
94
-
95
-
96
-
97
-
98
-
99
-
100
-
101
-
102
-
103
-
104
-
105
-
106
-
107
-
108
-
109
-
110
-
111
-
112
-
113
-
114
-
115
-
116
-
117
-
118
-
119
-
120
-
121
-
122
-
123
-
124
-
125
-
126
-
127
-
128
-
129
-
130
-
131
-
132
-
133
-
134
-
135
-
136
-
137
-
138
-
139
-
140
-
141
-
142
-
143
-
144
-
145
-
146
-
147
-
148
-
149
-
150
-
151
-
152
-
153
-
154
-
155
-
156
-
157
-
158
-
159
-
160
-
161
-
162
-
163
-
164
-
165
-
166
-
167
-
168
-
169
-
170
-
171
-
172
-
173
-
174
-
175
-
176
-
177
-
178
-
179
-
180
-
181
-
182
-
183
-
184
-
185
-
186
-
187
-
188
-
189
-
190
-
191
-
192
-
193
-
194
-
195
-
196
-
197
-
198
-
199
-
200
-
201
-
202
-
203
-
204
-
205
-
206
-
207
-
208
-
209
-
210
 |
 |

AIG ■2005 Annual Report 1
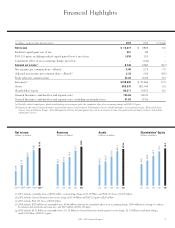
Financial Highlights
(in millions, except per share data and ratios) 2005 2004 % Change
Net income $ 10,477 $ 9,839 6.5
Realized capital gains, net of tax 201 85 –
FAS 133 gains, excluding realized capital gains (losses), net of tax 1,530 315 –
Cumulative effect of an accounting change, net of tax –(144) –
Adjusted net income(a) 8,746 9,583 (8.7)
Net income, per common share – diluted 3.99 3.73 7.0
Adjusted net income, per common share – diluted(a) 3.33 3.64 (8.5)
Book value per common share 33.24 30.69 8.3
Revenues(b) $108,905 $ 97,666 11.5
Assets 853,370 801,145 6.5
Shareholders’ equity 86,317 79,673 8.3
General Insurance combined loss and expense ratio 104.69 100.30
General Insurance combined loss and expense ratio, excluding catastrophe losses 97.63 97.56
(a) Excludes realized capital gains, which include pricing net investment gains, the cumulative effect of an accounting change and FAS 133 gains.
(b) Represents the sum of General Insurance net premiums earned, Life Insurance & Retirement Services GAAP premiums, net investment income, Financial Services
interest, lease and finance charges, Asset Management advisory and management fees and net investment income from guaranteed investment contracts, and realized
capital gains (losses).
Net Income
(billions of dollars)
’01(c) ’02(d) ’03(e) ’04(f) ’05(g)
4.09
5.73
8.11
9.84
10.48
Revenues
(billions of dollars)
’01 ’02 ’03 ’04 ’05
60.0
66.2
79.4
97.7
108.9
Assets
(billions of dollars)
’01 ’02 ’03 ’04 ’05
490.6
561.6
675.6
801.1
853.4
Shareholders’ Equity
(billions of dollars)
’01 ’02 ’03 ’04 ’05
49.9
58.3
69.2
79.7
86.3
(c) 2001 includes catastophe losses of $581 million, restructuring charges of $1.38 billion, and FAS 133 losses of $115 million.
(d) 2002 includes General Insurance loss reserve charge of $1.34 billion and FAS 133 gains of $20 million.
(e) 2003 includes FAS 133 losses of $697 million.
(f) 2004 includes $729 million in catastrophe losses, $144 million related to the cumulative effect of an accounting change, $553 million for a change in estimate
for asbestos and environmental exposures, and $315 million of FAS 133 gains.
(g) 2005 includes $2.11 billion in catastrophe losses, $1.19 billion for General Insurance fourth quarter reserve charge, $1.15 billion of settlement charges,
and $1.53 billion of FAS 133 gains.