eTrade 2002 Annual Report Download - page 20
Download and view the complete annual report
Please find page 20 of the 2002 eTrade annual report below. You can navigate through the pages in the report by either clicking on the pages listed below, or by using the keyword search tool below to find specific information within the annual report.-
 1
1 -
2
-
3
-
4
-
5
-
6
-
7
-
8
-
9
-
 10
10 -
 11
11 -
 12
12 -
 13
13 -
 14
14 -
 15
15 -
 16
16 -
 17
17 -
 18
18 -
 19
19 -
 20
20 -
 21
21 -
 22
22 -
 23
23 -
 24
24 -
 25
25 -
 26
26 -
 27
27 -
 28
28 -
 29
29 -
 30
30 -
31
-
32
-
33
-
34
-
35
-
36
-
37
-
38
-
39
-
40
-
41
-
42
-
43
-
44
-
45
-
46
-
47
-
48
-
49
-
50
-
51
-
52
-
53
-
54
-
55
-
56
-
57
-
58
-
59
-
60
-
61
-
62
-
63
-
64
-
65
-
66
-
67
-
68
-
69
-
70
-
71
-
72
-
73
-
74
-
75
-
76
-
77
-
78
-
79
-
80
-
81
-
82
-
83
-
84
-
85
-
86
-
87
-
88
-
89
-
90
-
91
-
92
-
93
-
94
-
95
-
96
-
97
-
98
-
99
-
100
-
101
-
102
-
103
-
104
-
105
-
106
-
107
-
108
-
109
-
110
-
111
-
112
-
113
-
114
-
115
-
116
-
117
-
118
-
119
-
120
-
121
-
122
-
123
-
124
-
125
-
126
-
127
-
128
-
129
-
130
-
131
-
132
-
133
-
134
-
135
-
136
-
137
-
138
-
139
-
140
-
141
-
142
-
143
-
144
-
145
-
146
-
147
-
148
-
149
-
150
-
151
-
152
-
153
-
154
-
155
-
156
-
157
-
158
-
159
-
160
-
161
-
162
-
163
-
164
-
165
-
166
-
167
-
168
-
169
-
170
-
171
-
172
-
173
-
174
-
175
-
176
-
177
-
178
-
179
-
180
-
181
-
182
-
183
-
184
-
185
-
186
-
187
-
188
-
189
-
190
-
191
-
192
-
193
-
194
-
195
-
196
-
197
-
198
-
199
-
200
-
201
-
202
-
203
-
204
-
205
-
206
-
207
-
208
-
209
-
210
-
211
-
212
-
213
-
214
-
215
-
216
 |
 |

Table of Contents
Index to Financial Statements
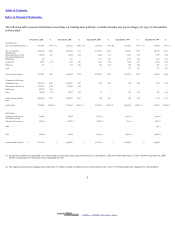
The following table allocates the allowance for loan losses by loan category at the dates indicated. This allocation does not necessarily restrict
the use of the allowance to absorb losses in any other category. The table shows the percentage of total loans that each loan category represents
(dollars in thousands):
December 31,
2002
December 31,
2001
September 30,
2000
September 30,
1999
September 30,
1998
Amount Percent of
Loans in Each
Category to
Total Loans
Amount Percent of
Loans in Each
Category to
Total Loans
Amount Percent of
Loans in Each
Category to
Total Loans
Amount Percent of
Loans in Each
Category to
Total Loans
Amount Percent of
Loans in Each
Category to
Total Loans
Real estate loans:
One- tofour-family $ 3,343 46.92 %
$ 8,716 79.06 %
$ 10,554 99.81 %
$ 7,055 99.67 %
$ 4,089 97.55 %
Home equity lines of
credit and second
mortgage loans
649 4.93 115 0.29 29 0.10 9 0.05 57 0.64
Commercial 201 0.19 30 0.03 336 0.06 53 0.14 520 0.97
Mixed-use 1 — 9 0.01 8 0.01 17 0.04 9 0.10
Land — — — — — — — 0.01 6 0.03
Multi-family — — 3 — 3 0.01 23 0.06 32 0.35
Total real estate loans 4,194 52.04 8,873 79.39 10,930 99.99 7,157 99.97 4,713 99.64
Consumer loans:
Automobiles 8,190 20.57 11,001 20.46 — — — — — —
Recreational vehicles 9,480 18.98 — — — — — — — —
Marine 3,108 6.30 — — — — — — — —
Other consumer 2,694 2.11 — 0.15 — 0.01 4 0.03 53 0.36
Total consumer loans 23,472 47.96 11,001 20.61 — 0.01 4 0.03 53 0.36
Total allowance for
loan losses
$ 27,666 100.00 %
$ 19,874 100.00 %
$ 10,930 100.00 %
$ 7,161 100.00 %
$ 4,766 100.00 %
The above amounts include specific reserves related to non-performing loans totaling $166,100 at December 31, 2002, $2.1 million at
December 31, 2001, $391,000 at September 30, 2000, $406,000 at September 30, 1999 and $449,000 at September 30, 1998.
11
2003. EDGAR Online, Inc.