eTrade 2002 Annual Report Download - page 12
Download and view the complete annual report
Please find page 12 of the 2002 eTrade annual report below. You can navigate through the pages in the report by either clicking on the pages listed below, or by using the keyword search tool below to find specific information within the annual report.-
 1
1 -
 2
2 -
 3
3 -
 4
4 -
 5
5 -
 6
6 -
 7
7 -
 8
8 -
 9
9 -
 10
10 -
 11
11 -
 12
12 -
 13
13 -
 14
14 -
 15
15 -
 16
16 -
 17
17 -
 18
18 -
 19
19 -
 20
20 -
 21
21 -
 22
22 -
23
-
24
-
25
-
26
-
27
-
28
-
29
-
30
-
31
-
32
-
33
-
34
-
35
-
36
-
37
-
38
-
39
-
40
-
41
-
42
-
43
-
44
-
45
-
46
-
47
-
48
-
49
-
50
-
51
-
52
-
53
-
54
-
55
-
56
-
57
-
58
-
59
-
60
-
61
-
62
-
63
-
64
-
65
-
66
-
67
-
68
-
69
-
70
-
71
-
72
-
73
-
74
-
75
-
76
-
77
-
78
-
79
-
80
-
81
-
82
-
83
-
84
-
85
-
86
-
87
-
88
-
89
-
90
-
91
-
92
-
93
-
94
-
95
-
96
-
97
-
98
-
99
-
100
-
101
-
102
-
103
-
104
-
105
-
106
-
107
-
108
-
109
-
110
-
111
-
112
-
113
-
114
-
115
-
116
-
117
-
118
-
119
-
120
-
121
-
122
-
123
-
124
-
125
-
126
-
127
-
128
-
129
-
130
-
131
-
132
-
133
-
134
-
135
-
136
-
137
-
138
-
139
-
140
-
141
-
142
-
143
-
144
-
145
-
146
-
147
-
148
-
149
-
150
-
151
-
152
-
153
-
154
-
155
-
156
-
157
-
158
-
159
-
160
-
161
-
162
-
163
-
164
-
165
-
166
-
167
-
168
-
169
-
170
-
171
-
172
-
173
-
174
-
175
-
176
-
177
-
178
-
179
-
180
-
181
-
182
-
183
-
184
-
185
-
186
-
187
-
188
-
189
-
190
-
191
-
192
-
193
-
194
-
195
-
196
-
197
-
198
-
199
-
200
-
201
-
202
-
203
-
204
-
205
-
206
-
207
-
208
-
209
-
210
-
211
-
212
-
213
-
214
-
215
-
216
 |
 |

Table of Contents
Index to Financial Statements
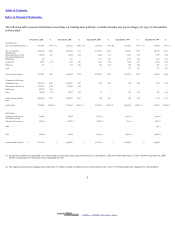
Maturity of Loan Portfolio. The following table shows, as of December 31, 2002, the dollar amount of loans maturing in our portfolio in the
time periods indicated. This information includes scheduled principal repayments, based on the loans’ contractual maturities. The table below
does not include any estimate of prepayments. Prepayments may significantly shorten the average life of a loan and may cause our actual
repayment experience to differ from that shown in the following table (in thousands):
DueinOne YearorLess Due in One toFiveYears Due After Five Years Total
Real estate loans:
One- to four-family fixed-rate $ 64 $ 2,921 $ 1,874,280 $ 1,877,265
One- to four-family adjustable-rate 20 607 1,501,597 1,502,224
Home equity lines of credit and second mortgage loans 29 513 354,226 354,768
Multi-family — — 106 106
Commercial — 13,067 330 13,397
Mixed-use — 7 114 121
Total real estate loans 113 17,115 3,730,653 3,747,881
Consumer and other loans:
Automobiles loans 14,566 1,386,470 80,659 1,481,695
Recreational vehicles loans 272 16,251 1,350,353 1,366,876
Marine loans 136 3,765 449,882 453,783
Other 11,628 89,403 51,614 152,645
Total consumer and other loans 26,602 1,495,889 1,932,508 3,454,999
Total loans $ 26,715 $ 1,513,004 $ 5,663,161 $ 7,202,880
The following table shows, as of December 31, 2002, the dollar amount of our loans distinguishing between those with fixed interest rates and
those with adjustable interest rates (in thousands):
Fixed Rates Adjustable Rates Total
Real estate loans:
One- to four-family $ 1,877,265 $ 1,502,224 $ 3,379,489
Home equity lines of credit and second mortgage loans 51,458 303,310 354,768
Multi-family — 106 106
Commercial 1,072 12,325 13,397
Mixed-use 121 — 121
Total real estate loans 1,929,916 1,817,965 3,747,881
Consumer and other loans:
Automobiles loans 1,481,695 — 1,481,695
Recreational vehicles loans 1,366,876 — 1,366,876
Marine loans 453,783 — 453,783
Other 152,623 22 152,645
Total consumer and other loans 3,454,977 22 3,454,999
Total loans $ 5,384,893 $ 1,817,987 $ 7,202,880
2003. EDGAR Online, Inc.