eTrade 2002 Annual Report Download - page 19
Download and view the complete annual report
Please find page 19 of the 2002 eTrade annual report below. You can navigate through the pages in the report by either clicking on the pages listed below, or by using the keyword search tool below to find specific information within the annual report.-
 1
1 -
2
-
3
-
4
-
5
-
6
-
7
-
8
-
 9
9 -
 10
10 -
 11
11 -
 12
12 -
 13
13 -
 14
14 -
 15
15 -
 16
16 -
 17
17 -
 18
18 -
 19
19 -
 20
20 -
 21
21 -
 22
22 -
 23
23 -
 24
24 -
 25
25 -
 26
26 -
 27
27 -
 28
28 -
 29
29 -
30
-
31
-
32
-
33
-
34
-
35
-
36
-
37
-
38
-
39
-
40
-
41
-
42
-
43
-
44
-
45
-
46
-
47
-
48
-
49
-
50
-
51
-
52
-
53
-
54
-
55
-
56
-
57
-
58
-
59
-
60
-
61
-
62
-
63
-
64
-
65
-
66
-
67
-
68
-
69
-
70
-
71
-
72
-
73
-
74
-
75
-
76
-
77
-
78
-
79
-
80
-
81
-
82
-
83
-
84
-
85
-
86
-
87
-
88
-
89
-
90
-
91
-
92
-
93
-
94
-
95
-
96
-
97
-
98
-
99
-
100
-
101
-
102
-
103
-
104
-
105
-
106
-
107
-
108
-
109
-
110
-
111
-
112
-
113
-
114
-
115
-
116
-
117
-
118
-
119
-
120
-
121
-
122
-
123
-
124
-
125
-
126
-
127
-
128
-
129
-
130
-
131
-
132
-
133
-
134
-
135
-
136
-
137
-
138
-
139
-
140
-
141
-
142
-
143
-
144
-
145
-
146
-
147
-
148
-
149
-
150
-
151
-
152
-
153
-
154
-
155
-
156
-
157
-
158
-
159
-
160
-
161
-
162
-
163
-
164
-
165
-
166
-
167
-
168
-
169
-
170
-
171
-
172
-
173
-
174
-
175
-
176
-
177
-
178
-
179
-
180
-
181
-
182
-
183
-
184
-
185
-
186
-
187
-
188
-
189
-
190
-
191
-
192
-
193
-
194
-
195
-
196
-
197
-
198
-
199
-
200
-
201
-
202
-
203
-
204
-
205
-
206
-
207
-
208
-
209
-
210
-
211
-
212
-
213
-
214
-
215
-
216
 |
 |

Table of Contents
Index to Financial Statements
by management for probable losses on specific loans. See also Notes 2 and 6 of Item 8. Consolidated Financial Statements and Supplementary
Data.
The general allowance is computed on loans based on an assessment of loans not specifically reviewed. Our policy requires that the level of the
provision is, at a minimum, sufficient to absorb twelve months of projected losses for all loan types because we believe this is indicative of the
probable losses inherent in the loan portfolio at that date. It may be appropriate after considering the factors detailed above to increase the level
of the general allowance in excess of twelve months of expected losses to account for uncertainties in the economy. In determining the
adequacy of the general allowance, the assumptions underlying the twelve-month loss projection are validated through analyzing actual loss
experience, industry loss experience and changes in portfolio quality. Consideration is given to changes in economic conditions and the
potential impact on the loan portfolio’ s performance. For loan portfolios that are considered unseasoned and lacking in meaningful historic loss
data, we utilize appropriate industry charge-off and loss rates as a proxy for the bank’ s actual loss experience. As the loan portfolios season and
actual loss data matures, we rely on industry loss experience as a validation tool and not the final determinant of projected losses.
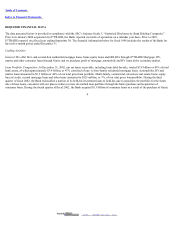
The loan loss provision recorded for fiscal 2002 was based upon our assessment of the required allowances at December 31, 2002. The increase
in the loan loss provision as compared to fiscal 2001 is principally attributable to the increased level of charge-offs resulting from a higher
concentration in consumer loan types that typically experience charge-offs at a higher rate than single-family mortgage loans. We believe that
the level of our loan loss allowance is adequate to cover probable losses inherent in our portfolio at December 31, 2002.
The addition to our portfolio of $2.8 billion of consumer automobile, marine and RV loans, which traditionally have a higher loss experience
than residential mortgages, creates additional credit risk. Historical charge-offs were $32.0 million in fiscal 2002, $5.6 million in fiscal 2001,
$12,000 for the three months ended December 31, 2000 and $253,000 in fiscal 2000. Based on our analysis of the loan portfolio’ s historic loss
experience and our estimate of projected losses inherent in the loan portfolio we believe the allowances for loan losses, which were $27.7
million (0.50% of total loans held-for-investment) at December 31, 2002 and $19.9million (0.25% of total loans held-for-investment) at
December 31, 2001, were appropriate and in accordance with the Bank’ s approved policy on allowance for loan losses.
We believe that we have established our existing loss allowances in accordance with accounting principles generally accepted in the United
States of America. However, circumstances may change, and regulators may request us to increase our allowance for losses. Such an increase
could negatively affect our financial condition and earnings.
10
2003. EDGAR Online, Inc.