Yamaha 2011 Annual Report Download - page 6
Download and view the complete annual report
Please find page 6 of the 2011 Yamaha annual report below. You can navigate through the pages in the report by either clicking on the pages listed below, or by using the keyword search tool below to find specific information within the annual report.-
 1
1 -
 2
2 -
 3
3 -
 4
4 -
 5
5 -
 6
6 -
 7
7 -
 8
8 -
 9
9 -
 10
10 -
 11
11 -
 12
12 -
 13
13 -
 14
14 -
 15
15 -
 16
16 -
 17
17 -
18
-
19
-
20
-
21
-
22
-
23
-
24
-
25
-
26
-
27
-
28
-
29
-
30
-
31
-
32
-
33
-
34
-
35
-
36
-
37
-
38
-
39
-
40
-
41
-
42
-
43
-
44
-
45
-
46
-
47
-
48
-
49
-
50
-
51
-
52
-
53
-
54
-
55
-
56
-
57
-
58
-
59
-
60
-
61
-
62
-
63
-
64
-
65
-
66
-
67
-
68
-
69
-
70
-
71
-
72
-
73
-
74
-
75
-
76
-
77
-
78
-
79
-
80
-
81
-
82
-
83
-
84
-
85
-
86
-
87
-
88
-
89
-
90
-
91
-
92
-
93
-
94
 |
 |

Yamaha Corporation
Key Figures
Fiscal year ended March 31, 2011
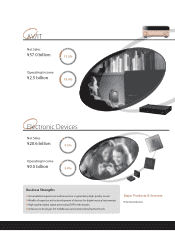
Musical Instruments 72.5%
Others 6.7%
Electronic Devices 5.5%
AV/IT 15.3%
¥5.1 billion
¥13.2 billion
1.3 %
2.1 %
y Net Sales
y Operating Income
y Net Income
y ROE
y ROA
Sales by
Business Segment
Japan
Europe
North America
Asia, Oceania and Other Areas
48.0%
17.3%
14.6%
20.1%
Sales by Region
¥373.9 billion
+92.8%
—
+4.1
points
+2.5
points
-9.9%
Change from the previous year
4