World Fuel Services 2011 Annual Report Download - page 5
Download and view the complete annual report
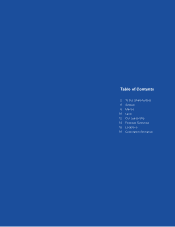
Please find page 5 of the 2011 World Fuel Services annual report below. You can navigate through the pages in the report by either clicking on the pages listed below, or by using the keyword search tool below to find specific information within the annual report.-
 1
1 -
 2
2 -
 3
3 -
 4
4 -
 5
5 -
 6
6 -
 7
7 -
 8
8 -
 9
9 -
 10
10 -
 11
11 -
 12
12 -
 13
13 -
 14
14 -
 15
15 -
 16
16 -
17
-
18
-
19
-
20
-
21
-
22
-
23
-
24
-
25
-
26
-
27
-
28
-
29
-
30
-
31
-
32
-
33
-
34
-
35
-
36
-
37
-
38
-
39
-
40
-
41
-
42
-
43
-
44
-
45
-
46
-
47
-
48
-
49
-
50
-
51
-
52
-
53
-
54
-
55
-
56
-
57
-
58
-
59
-
60
-
61
-
62
-
63
-
64
-
65
-
66
-
67
-
68
-
69
-
70
-
71
-
72
-
73
-
74
-
75
-
76
-
77
-
78
-
79
-
80
-
81
-
82
-
83
-
84
-
85
-
86
-
87
-
88
-
89
-
90
-
91
-
92
-
93
-
94
-
95
-
96
-
97
-
98
-
99
-
100
-
101
-
102
-
103
-
104
-
105
-
106
-
107
-
108
-
109
-
110
-
111
-
112
-
113
-
114
-
115
-
116
-
117
-
118
 |
 |

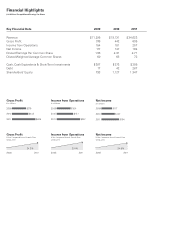
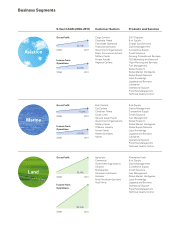
Business Segments
Customer Sectors Products and Services5-Year CAGR (2006–2011)
Gross Profit
20112006
14.0%
Income from
Operations
20112006
16.8%
Bulk Carriers
Car Carriers
Container Fleets
Cruise Lines
General Cargo Fleets
Government Organizations
Military Fleets
Offshore Industry
Tanker Fleets
Reefer Operators
Yachts
Bulk Supply
Claims Management
Competitive Supply
Credit Solutions
Fuel Management
Global Footprint
Global Market Intelligence
Global Supply Network
Local Knowledge
Logistics and Services
Lubricants
Operational Support
Price Risk Management
Technical Quality Control
Marine
Cargo Carriers
Corporate Fleets
Fixed Base Operators
Fractional Operators
Government Organizations
Major Commercial Airlines
Military Fleets
Private Aircraft
Regional Carriers
24/ 7 Dispatch
Bulk Supply
Charge Card Services
Claims Management
Competitive Supply
Credit Solutions
De-icing Products and Services
FBO Marketing and Network
Flight Planning and Services
Fuel Management
Global Footprint
Global Market Intelligence
Global Supply Network
Local Knowledge
Logistics and Services
Lubricants
Operational Support
Price Risk Management
Technical Quality Control
Income from
Operations
20112006
20.9%
20112006
23.4%
Gross Profit
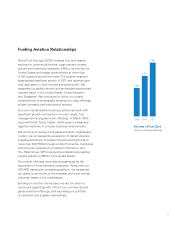
Aviation
Agriculture
Commercial
Government Organizations
Industrial
Municipalities
Petroleum Distributors
Railroads
Retail Petroleum Operators
Truck Fleets
Alternative Fuels
Bulk Supply
Claims Management
Competitive Supply
Credit Solutions
Fuel Management
Global Market Intelligence
Local Knowledge
Logistics and Services
Operational Support
Price Risk Management
Technical Quality Control
20112006
85.9%
Gross Profit
122.5%
20112006
Income from
Operations
LandLand