Windstream 2006 Annual Report Download - page 173
Download and view the complete annual report
Please find page 173 of the 2006 Windstream annual report below. You can navigate through the pages in the report by either clicking on the pages listed below, or by using the keyword search tool below to find specific information within the annual report.-
 1
1 -
2
-
3
-
4
-
5
-
6
-
7
-
8
-
9
-
10
-
11
-
12
-
13
-
14
-
15
-
16
-
17
-
18
-
19
-
20
-
21
-
22
-
23
-
24
-
25
-
26
-
27
-
28
-
29
-
30
-
31
-
32
-
33
-
34
-
35
-
36
-
37
-
38
-
39
-
40
-
41
-
42
-
43
-
44
-
45
-
46
-
47
-
48
-
49
-
50
-
51
-
52
-
53
-
54
-
55
-
56
-
57
-
58
-
59
-
60
-
61
-
62
-
63
-
64
-
65
-
66
-
67
-
68
-
69
-
70
-
71
-
72
-
73
-
74
-
75
-
76
-
77
-
78
-
79
-
80
-
81
-
82
-
83
-
84
-
85
-
86
-
87
-
88
-
89
-
90
-
91
-
92
-
93
-
94
-
95
-
96
-
97
-
98
-
99
-
100
-
101
-
102
-
103
-
104
-
105
-
106
-
107
-
108
-
109
-
110
-
111
-
112
-
113
-
114
-
115
-
116
-
117
-
118
-
119
-
120
-
121
-
122
-
123
-
124
-
125
-
126
-
127
-
128
-
129
-
130
-
131
-
132
-
133
-
134
-
135
-
136
-
137
-
138
-
139
-
140
-
141
-
142
-
143
-
144
-
145
-
146
-
147
-
148
-
149
-
150
-
151
-
152
-
153
-
154
-
155
-
156
-
157
-
158
-
159
-
160
-
161
-
162
-
 163
163 -
 164
164 -
 165
165 -
 166
166 -
 167
167 -
 168
168 -
 169
169 -
 170
170 -
 171
171 -
 172
172 -
 173
173 -
 174
174 -
 175
175 -
 176
176 -
 177
177 -
 178
178 -
 179
179 -
 180
180 -
 181
181 -
 182
182
 |
 |

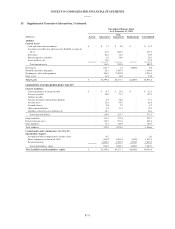
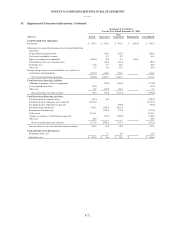
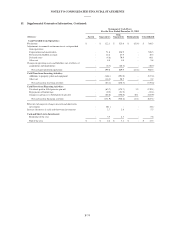
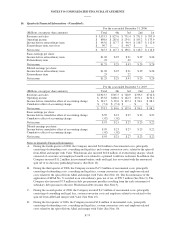
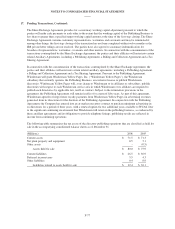
NOTES TO CONSOLIDATED FINANCIAL STATEMENTS
15. Supplemental Guarantor Information, Continued:
Statement of Cash Flows
For the Year Ended December 31, 2006
(Millions) Parent Guarantors
Non-
Guarantors Eliminations Consolidated
Cash Provided from Operations:
Net income $ 545.3 $ 145.6 $ 545.8 $ (691.4) $ 545.3
Adjustments to reconcile net income to net cash provided from
operations:
Depreciation and amortization - 116.6 333.0 - 449.6
Provision for doubtful accounts - 8.5 9.9 - 18.4
Equity in earnings from subsidiary (688.5) (9.4) 6.5 691.4 -
Extraordinary item, net of income taxes - (36.3) (63.4) - (99.7)
Deferred taxes 14.5 5.5 10.2 - 30.2
Other, net 1.5 1.6 13.5 - 16.6
Changes in operating assets and liabilities, net of effects of
acquisitions and dispositions: (837.4) 810.6 191.6 - 164.8
Net cash provided from operations (964.6) 1,042.7 1,047.1 - 1,125.2
Cash Flows from Investing Activities:
Additions to property, plant and equipment - (32.0) (341.8) - (373.8)
Cash acquired from Valor 69.0 - - - 69.0
Other, net 0.4 (23.0) 28.4 - 5.8
Net cash used in investing activities 69.4 (55.0) (313.4) - (299.0)
Cash Flows from Financing Activities:
Dividends paid on common shares (97.3) (4.9) - - (102.2)
Dividends paid to Alltel pursuant to spin-off (2,275.1) - - - (2,275.1)
Dividends paid to Alltel prior to spin-off - - (99.0) - (99.0)
Dividends from subsidiaries 443.3 (150.2) (293.1) - -
Repayments of borrowings - (795.6) (75.8) - (871.4)
Debt issued 3,156.1 - - - 3,156.1
Changes in advances to Alltel prior to spin-off - (43.5) (246.8) - (290.3)
Other, net 30.6 - - - 30.6
Net cash used in financing activities 1,257.6 (994.2) (714.7) - (451.3)
Increase (decrease) in cash and short-term investments 362.4 (6.5) 19.0 - 374.9
Cash and Short-term Investments:
Beginning of the year - 7.1 4.8 - 11.9
End of the year $ 362.4 $ 0.6 $ 23.8 $ - $ 386.8
F-72