Western Digital 2013 Annual Report Download - page 4
Download and view the complete annual report
Please find page 4 of the 2013 Western Digital annual report below. You can navigate through the pages in the report by either clicking on the pages listed below, or by using the keyword search tool below to find specific information within the annual report.-
 1
1 -
 2
2 -
 3
3 -
 4
4 -
 5
5 -
 6
6 -
 7
7 -
 8
8 -
 9
9 -
 10
10 -
 11
11 -
 12
12 -
 13
13 -
 14
14 -
 15
15 -
16
-
17
-
18
-
19
-
20
-
21
-
22
-
23
-
24
-
25
-
26
-
27
-
28
-
29
-
30
-
31
-
32
-
33
-
34
-
35
-
36
-
37
-
38
-
39
-
40
-
41
-
42
-
43
-
44
-
45
-
46
-
47
-
48
-
49
-
50
-
51
-
52
-
53
-
54
-
55
-
56
-
57
-
58
-
59
-
60
-
61
-
62
-
63
-
64
-
65
-
66
-
67
-
68
-
69
-
70
-
71
-
72
-
73
-
74
-
75
-
76
-
77
-
78
-
79
-
80
-
81
-
82
-
83
-
84
-
85
-
86
-
87
-
88
-
89
-
90
-
91
-
92
-
93
-
94
-
95
-
96
-
97
-
98
-
99
-
100
-
101
-
102
-
103
-
104
-
105
-
106
-
107
-
108
-
109
-
110
-
111
-
112
-
113
-
114
-
115
-
116
 |
 |

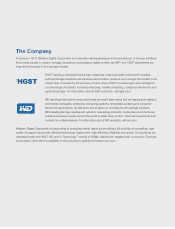
Our broad-based participation in the creation,
management, experience and preservation of digital data
is resulting in a more diversied revenue mix. Over the
last ve years our non-PC related businesses have grown
from 34% to 50% of our revenue, driven by our enterprise
and branded products businesses, both of which address
cloud computing. PCs remain an important market for our
products, but we are less reliant on them than at any time
since the inception of the PC.
We are well positioned to capitalize on an important long-
term secular growth trend — the ongoing expansion in
digital data — as consumers and commercial enterprises
increasingly interact with digital content on a daily basis.
We are seeing dramatic changes in the storage
industry — changes in the needs, use cases and
buying patterns of existing and new customers as
they grapple with the challenges of managing this
growth. This has resulted in more strategic relationships
with customers, as we collaborate, innovate and
create additional value with our signicant technology
resources and highly experienced storage teams.
We have established a leadership position in the fastest
growing areas of the industry and in the last year we have
introduced several new products aimed at building on this
leadership, including our:
• 7-platter, helium sealed drives that address the energy
and space cost challenges of our cloud infrastructure
customers,
• low-prole 5 and 7 millimeter solid state hybrid drives
and hard drives designed for new ultraportable
devices,
• hard drive and NAS solutions for small and
medium-sized businesses (SMB), and
• expanding offering of enterprise-class solid state
drives for the most demanding applications in tiered
enterprise storage architectures.
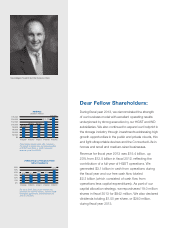
$0
$500
$1,000
$1,500
$2,000
$2,500
$3,000
$3,500
FY2009 FY2010 FY2011 FY2012 FY2013
$1,023
$1,312
$2,334 $2,354
NET CASH
Dollars in millions
$3,196
Net cash (cash and cash equivalents less
debt) ended the year at $2.4 billion, up
$1.3 billion from the end of scal 2012.
$0
$400
$800
$1,200
$1,600
$2,000
$2,400
$2,800
$3,200
FY2009 FY2010 FY2011 FY2012 FY2013
$1,655
$3,067 $3,119
$1,942
$1,305
CASH FLOW FROM OPERATIONS
Dollars in millions
Strong protability and disciplined balance
sheet management generated cash ows from
operations of $3.1 billion during scal 2013.
$0
$200
$400
$600
$800
$1,000
$1,200
$1,400
$1,600
FY2009 FY2010 FY2011 FY2012 FY2013
$611 $703
$1,055
$1,572
$509
RESEARCH AND DEVELOPMENT SPENDING
Dollars in millions
Research and development continued to
increase as we invested in new products
and innovative technology to meet
customer needs.
$0
$1.00
$2.00
$3.00
$4.00
$5.00
$6.00
$7.00
$8.00
FY2009 FY2010 FY2011 FY2012 FY2013
$3.09
$3.98
$6.58
$2.08
$5.93
EARNINGS PER SHARE
A highly efcient business model, focus on
operational excellence and experienced
management team underpin our ability
to deliver solid protability. Fiscal 2013
included a $681 million charge related to
an arbitration award.