Western Digital 2009 Annual Report Download - page 4
Download and view the complete annual report
Please find page 4 of the 2009 Western Digital annual report below. You can navigate through the pages in the report by either clicking on the pages listed below, or by using the keyword search tool below to find specific information within the annual report.-
 1
1 -
 2
2 -
 3
3 -
 4
4 -
 5
5 -
 6
6 -
 7
7 -
 8
8 -
 9
9 -
 10
10 -
 11
11 -
 12
12 -
 13
13 -
 14
14 -
 15
15 -
16
-
17
-
18
-
19
-
20
-
21
-
22
-
23
-
24
-
25
-
26
-
27
-
28
-
29
-
30
-
31
-
32
-
33
-
34
-
35
-
36
-
37
-
38
-
39
-
40
-
41
-
42
-
43
-
44
-
45
-
46
-
47
-
48
-
49
-
50
-
51
-
52
-
53
-
54
-
55
-
56
-
57
-
58
-
59
-
60
-
61
-
62
-
63
-
64
-
65
-
66
-
67
-
68
-
69
-
70
-
71
-
72
-
73
-
74
-
75
-
76
-
77
-
78
-
79
-
80
-
81
-
82
-
83
-
84
-
85
-
86
-
87
-
88
-
89
-
90
-
91
-
92
-
93
-
94
-
95
-
96
-
97
-
98
-
99
-
100
-
101
-
102
-
103
-
104
 |
 |

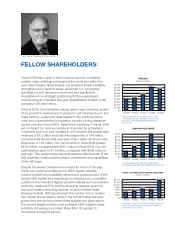
In calendar 2004, we identifi ed a growing trend in the digitization
of rich content and data on both the consumer and commercial
levels. At that point, we set out to diversify our product set beyond
desktop computing, where we fi rst established our reputation for
excellence in providing high capacity, cost-effective hard drives,
and we established a long-term goal of addressing storage needs
in all computing markets. In fi scal 2005, we derived 21 percent
of our revenue from non-desktop applications; in fi scal 2009 that
number grew to 62 percent of our revenue base. In this fi ve-year
period, we launched and became the industry’s leading supplier
of 2.5-inch mobile drives, we grew our shipments of enterprise
SATA drives, we introduced WD GreenPower Technology™
for environmentally sensitive enterprise environments, and we
established an industry leadership position in branded products
with a series of well-designed, user-friendly and stylish external
storage products. Following this meaningful diversifi cation, in fi scal
2009 our product offerings addressed some 83 percent of the
total available market for hard drives. The remaining unaddressed
storage markets such as the mainstream high-performance high-
capacity enterprise market, the high-performance low-capacity
solid-state market and the gaming market provide potential future
entry and growth.
In the same fi ve-year period, we worked diligently to establish an
advantaged cost structure as our primary competitive advantage
in the increasingly commoditized high-volume markets for hard
drives. We achieved this through a relentless focus on quality,
reliability, and fl exibility, and a careful leveraging of engineering
resources with a strategy of developing products for multiple
markets using the same core product platforms. Execution on
this strategy contributed to our high growth, highly profi table
performance and helped us to generate strong cash fl ow. With
a strong balance sheet, we have been able to expand our
investments in research and development, vertical integration and
prudently fund our capital needs.
This successful investment cycle in turn created opportunities to
lower costs further and to invest in the continued advancement
of areal density, secure future technology development and
ensure that we have the capability to produce anticipated product
volumes. As a result, in recent years WD has gained market share
and enriched its product mix with a fi rst-to-market position in new,
high capacity points, including these fi scal 2009 new product
introductions:
• WD VelociRaptor™, the industry’s fi rst 300 GB, 10,000 RPM,
2.5-inch SATA hard drive for the enterprise market in July 2008.
• The industry’s fi rst 500 GB, 2.5-inch hard drive for notebooks
and external storage applications in September 2008.
0.0
10.0
20.0
30.0
40.0
50.0
60.0
FY2005 FY2006 FY2007 FY2008 FY2009
2.5-INCH DRIVE SHIPMENTS
56.3
1.05.4
Amounts in millions
12.3
36.6
Refl ecting our technology and product leadership
in this high-growth market, WD increased 2.5-inch
drive shipments 54 percent from fi scal 2008.
REVENUE DIVERSIFICATION*
Dollars in millions
$3,639
$8,074
$0
$1,000
$2,000
$3,000
$4,000
$5,000
$6,000
$7,000
$8,000
$9,000
FY2005 FY2006 FY2007 FY2008 FY2009
$4,341
$5,468
$7,453
79%
21%
71%
29%
57%
43%
44%
56%
38%
62%
Desktop Revenue
Non-Desktop Revenue
* Revenue per entages are based on sales of hard drives only.
Remaining focused on our goal to diversify our
product set beyond desktop computing, hard drive
revenue from non-desktop markets expanded to
62 percent in fi scal 2009.
$0
$200
$400
$600
$800
$1,000
$1,200
FY2005 FY2006 FY2007 FY2008 FY2009
CAPITAL EXPENDITURES and
RESEARCH and DEVELOPMENT SPENDING
$1,028
$434 $565
Dollars in millions
$630
$1,079
Research and Development
Capital Expenditures
Fiscal 2009 represents the second year in which
the company invested over $1 billion in research
and development and capital expenditures.
c