Western Digital 2009 Annual Report Download - page 3
Download and view the complete annual report
Please find page 3 of the 2009 Western Digital annual report below. You can navigate through the pages in the report by either clicking on the pages listed below, or by using the keyword search tool below to find specific information within the annual report.-
 1
1 -
 2
2 -
 3
3 -
 4
4 -
 5
5 -
 6
6 -
 7
7 -
 8
8 -
 9
9 -
 10
10 -
 11
11 -
 12
12 -
 13
13 -
 14
14 -
15
-
16
-
17
-
18
-
19
-
20
-
21
-
22
-
23
-
24
-
25
-
26
-
27
-
28
-
29
-
30
-
31
-
32
-
33
-
34
-
35
-
36
-
37
-
38
-
39
-
40
-
41
-
42
-
43
-
44
-
45
-
46
-
47
-
48
-
49
-
50
-
51
-
52
-
53
-
54
-
55
-
56
-
57
-
58
-
59
-
60
-
61
-
62
-
63
-
64
-
65
-
66
-
67
-
68
-
69
-
70
-
71
-
72
-
73
-
74
-
75
-
76
-
77
-
78
-
79
-
80
-
81
-
82
-
83
-
84
-
85
-
86
-
87
-
88
-
89
-
90
-
91
-
92
-
93
-
94
-
95
-
96
-
97
-
98
-
99
-
100
-
101
-
102
-
103
-
104
 |
 |

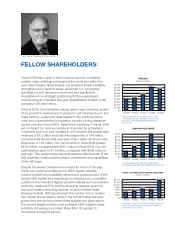
Fiscal 2009 was a year in which macroeconomic conditions
created major challenges throughout the world and within the
hard drive industry. Nevertheless, we remained solidly profitable,
strengthened our balance sheet, advanced our competitive
standing in a soft demand environment and significantly
strengthened our strategic positioning for the years ahead,
underscoring an important five-year diversification chapter in the
company’s 39-year history.
In fiscal 2009, the hard drive industry saw a year-over-year decline
of 20 percent in revenue and 5 percent in unit volumes due to two
major factors—a demand reset related to the world economic
crisis and unprecedented competitive industry pricing pressures
carried over from fiscal 2008. Against this backdrop, in fiscal 2009
we contained our revenue decline to 8 percent by achieving a
10 percent year-over-year increase in unit volumes. We posted total
revenues of $7.5 billion and hard drive shipments of 146 million,
compared with fiscal 2008 revenues of $8.1 billion and hard drive
shipments of 133 million. Our net income for fiscal 2009 totaled
$470 million, compared with $867 million in fiscal 2008. Our net
cash balance grew to $1.3 billion, compared with $595 million a
year ago. This performance demonstrates the effectiveness of the
WD business model and the passion, nimbleness and capabilities
of the WD team.
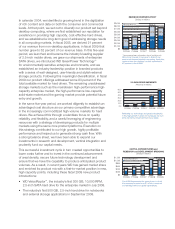
Despite the slower demand environment for much of the year,
continued customer preference for WD’s quality, reliability,
product breadth and availability earned us a growing share of the
overall HDD market and maintained or increased our competitive
position in the industry’s highest growth markets such as branded
products, notebook PCs and the emerging netbook space for
low-cost mobile computing devices. In each of these faster
growing markets, WD has achieved the number one or number
two market share position, while in the overall market we have
grown from the world’s number three supplier five years ago to
the second largest and the most profitable HDD supplier today,
profitably increasing our market share from 18 percent to
30 percent during this period.
John F. Coyne, President and Chief Executive Officer
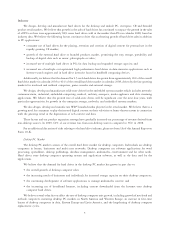
REVENUE
Dollars in millions
$3,639
$8,074
$0
$1,000
$2,000
$3,000
$4,000
$5,000
$6,000
$7,000
$8,000
$9,000
FY2005 FY2006 FY2007 FY2008 FY2009
$4,341
$5,468
$7,453
As a result of the world economic crisis and
unprecedented competitive industry pricing
pressure, revenue declined 8 percent from
fiscal 2008.
$0
$0.50
$1.00
$1.50
$2.00
$2.50
$3.00
$3.50
$4.00
FY2005 FY2006 FY2007 FY2008 FY2009
EARNINGS PER SHARE
$2.08
$2.50
$3.84
$0.90
$1.76
In a challenging year, WD was continuously
profitable and posted EPS of $2.08 for fiscal 2009.
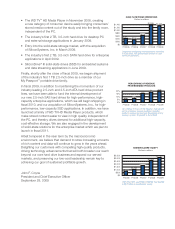
$0
$200
$400
$600
$800
$1,000
$1,200
$1,400
FY2005 FY2006 FY2007 FY2008 FY2009
CASH and CASH EQUIVALENTS LESS DEBT
$1,312
$595
$433 $507
Dollars in millions
$678
WD ended fiscal 2009 with $1.3 billion of net cash
and cash equivalents, an increase of over $700
million from fiscal 2008.
FELLOW SHAREHOLDERS: